VTune
References
Intel VTune Profiler User Guide
Downloadable documents for VTune Profiler
Introduction
Intel VTune Profiler can be used to find and fix performance bottleneck quickly. There are several options (i.e., GPU Hotspots analysis, GPU Offload analysis, and HPC Performance Characterization analysis) available for Intel CPUs and GPUs on Aurora.
Intel® VTune™ Profiler is a performance analysis tool for serial, multithreaded, GPU-accelerated applications. Use VTune Profiler to analyze your choice of algorithm. Identify potential benefits for your application on Intel CPUs and GPUs on Aurora.
Use VTune Profiler to locate or determine:
- The most time-consuming (hot) functions in your application and/or on the whole system
- Sections of code that do not effectively utilize available processor time
- The best sections of code to optimize for sequential performance and for threaded performance
- Synchronization objects that affect the application performance
- Whether, where, and why your application spends time on input/output operations
- Whether your application is CPU or GPU bound and how effectively it offloads code to the GPU
- The performance impact of different synchronization methods, different numbers of threads, or different algorithms
- Thread activity and transitions
- Hardware-related issues in your code such as data sharing, cache misses, branch misprediction, and others
VTune analysis types for Intel GPUs
GPU offload
$ vtune –collect gpu-offload <target>
This analysis enables you to: * Identify how effectively your application uses SYCL, OpenMP or OpenCL kernels and explore them further with GPU Compute/Media Hotspots analysis * Analyze execution of Intel Media SDK tasks over time * Explore GPU usage and analyze a software queue for GPU engines at each moment of time
GPU Compute/Meadia Hotspots
$ vtune –collect gpu-hotspots <target>
Use the GPU Compute/Media Hotspots analysis to: * Explore GPU kernels with high GPU utilization, estimate the effectiveness of this utilization, identify possible reasons for stalls or low occupancy and options. * Explore the performance of your application per selected GPU metrics over time. * Analyze the hottest SYCL* standards or OpenCL™ kernels for inefficient kernel code algorithms or incorrect work item configuration.
The GPU Compute/Media Hotspots analysis is a good next step if you have already run the GPU Offload analysis and identified: * a performance-critical kernel for further analysis and optimization; * a performance-critical kernel that it is tightly connected with other kernels in the program and may slow down their performance.
For source level in-kernal profiling, applications should to be bulit with -fdebug-info-for-profiling -gline-tables-only.
A quick instruction for VTune analysis on Intel GPUs
GPU hotspots analysis can be used as the first step. Without special knobs, its overhead is minimal and it provides useful performance data such as kernel time, instance count, SIMD width, EU Array active/stalled/idle ratio, EU occupancy, GPU barriers/atomic, and so on. The followings are simple instructions on Intel GPUs:
Running an application with VTune on Intel GPUs
module load oneapi

### To run an application on a single stack of a GPU
$ ZE_AFFINITY_MASK=0.0 vtune -collect gpu-hotspots -r VTune_results_1S -- ./a.out

### To run an application on two spacks of a single GPU
$ ZE_AFFINITY_MASK=0 vtune -collect gpu-hotspots -r VTune_results_2S -- ./a.out

### To run an MPI application (e.g., 24 MPI ranks on two Aurora nodes)
$ mpirun -n 24 gpu_tile_compact.sh vtune -collect gpu-hotspots -r VTune_results_MPI -- ./a.out

### To run an MPI application with VTune on a select MPI (e.g., MPI rank 5 out of 24 ranks)
$ mpirun -n 5 gpu_tile_compact.sh ./a.out : -n 1 gpu_tile_compact.sh vtune -collect gpu-hotspots -r VTune_results_MPI_5 -- ./a.out : -n 18 ./a.out
Checking if VTune collection is successful or not
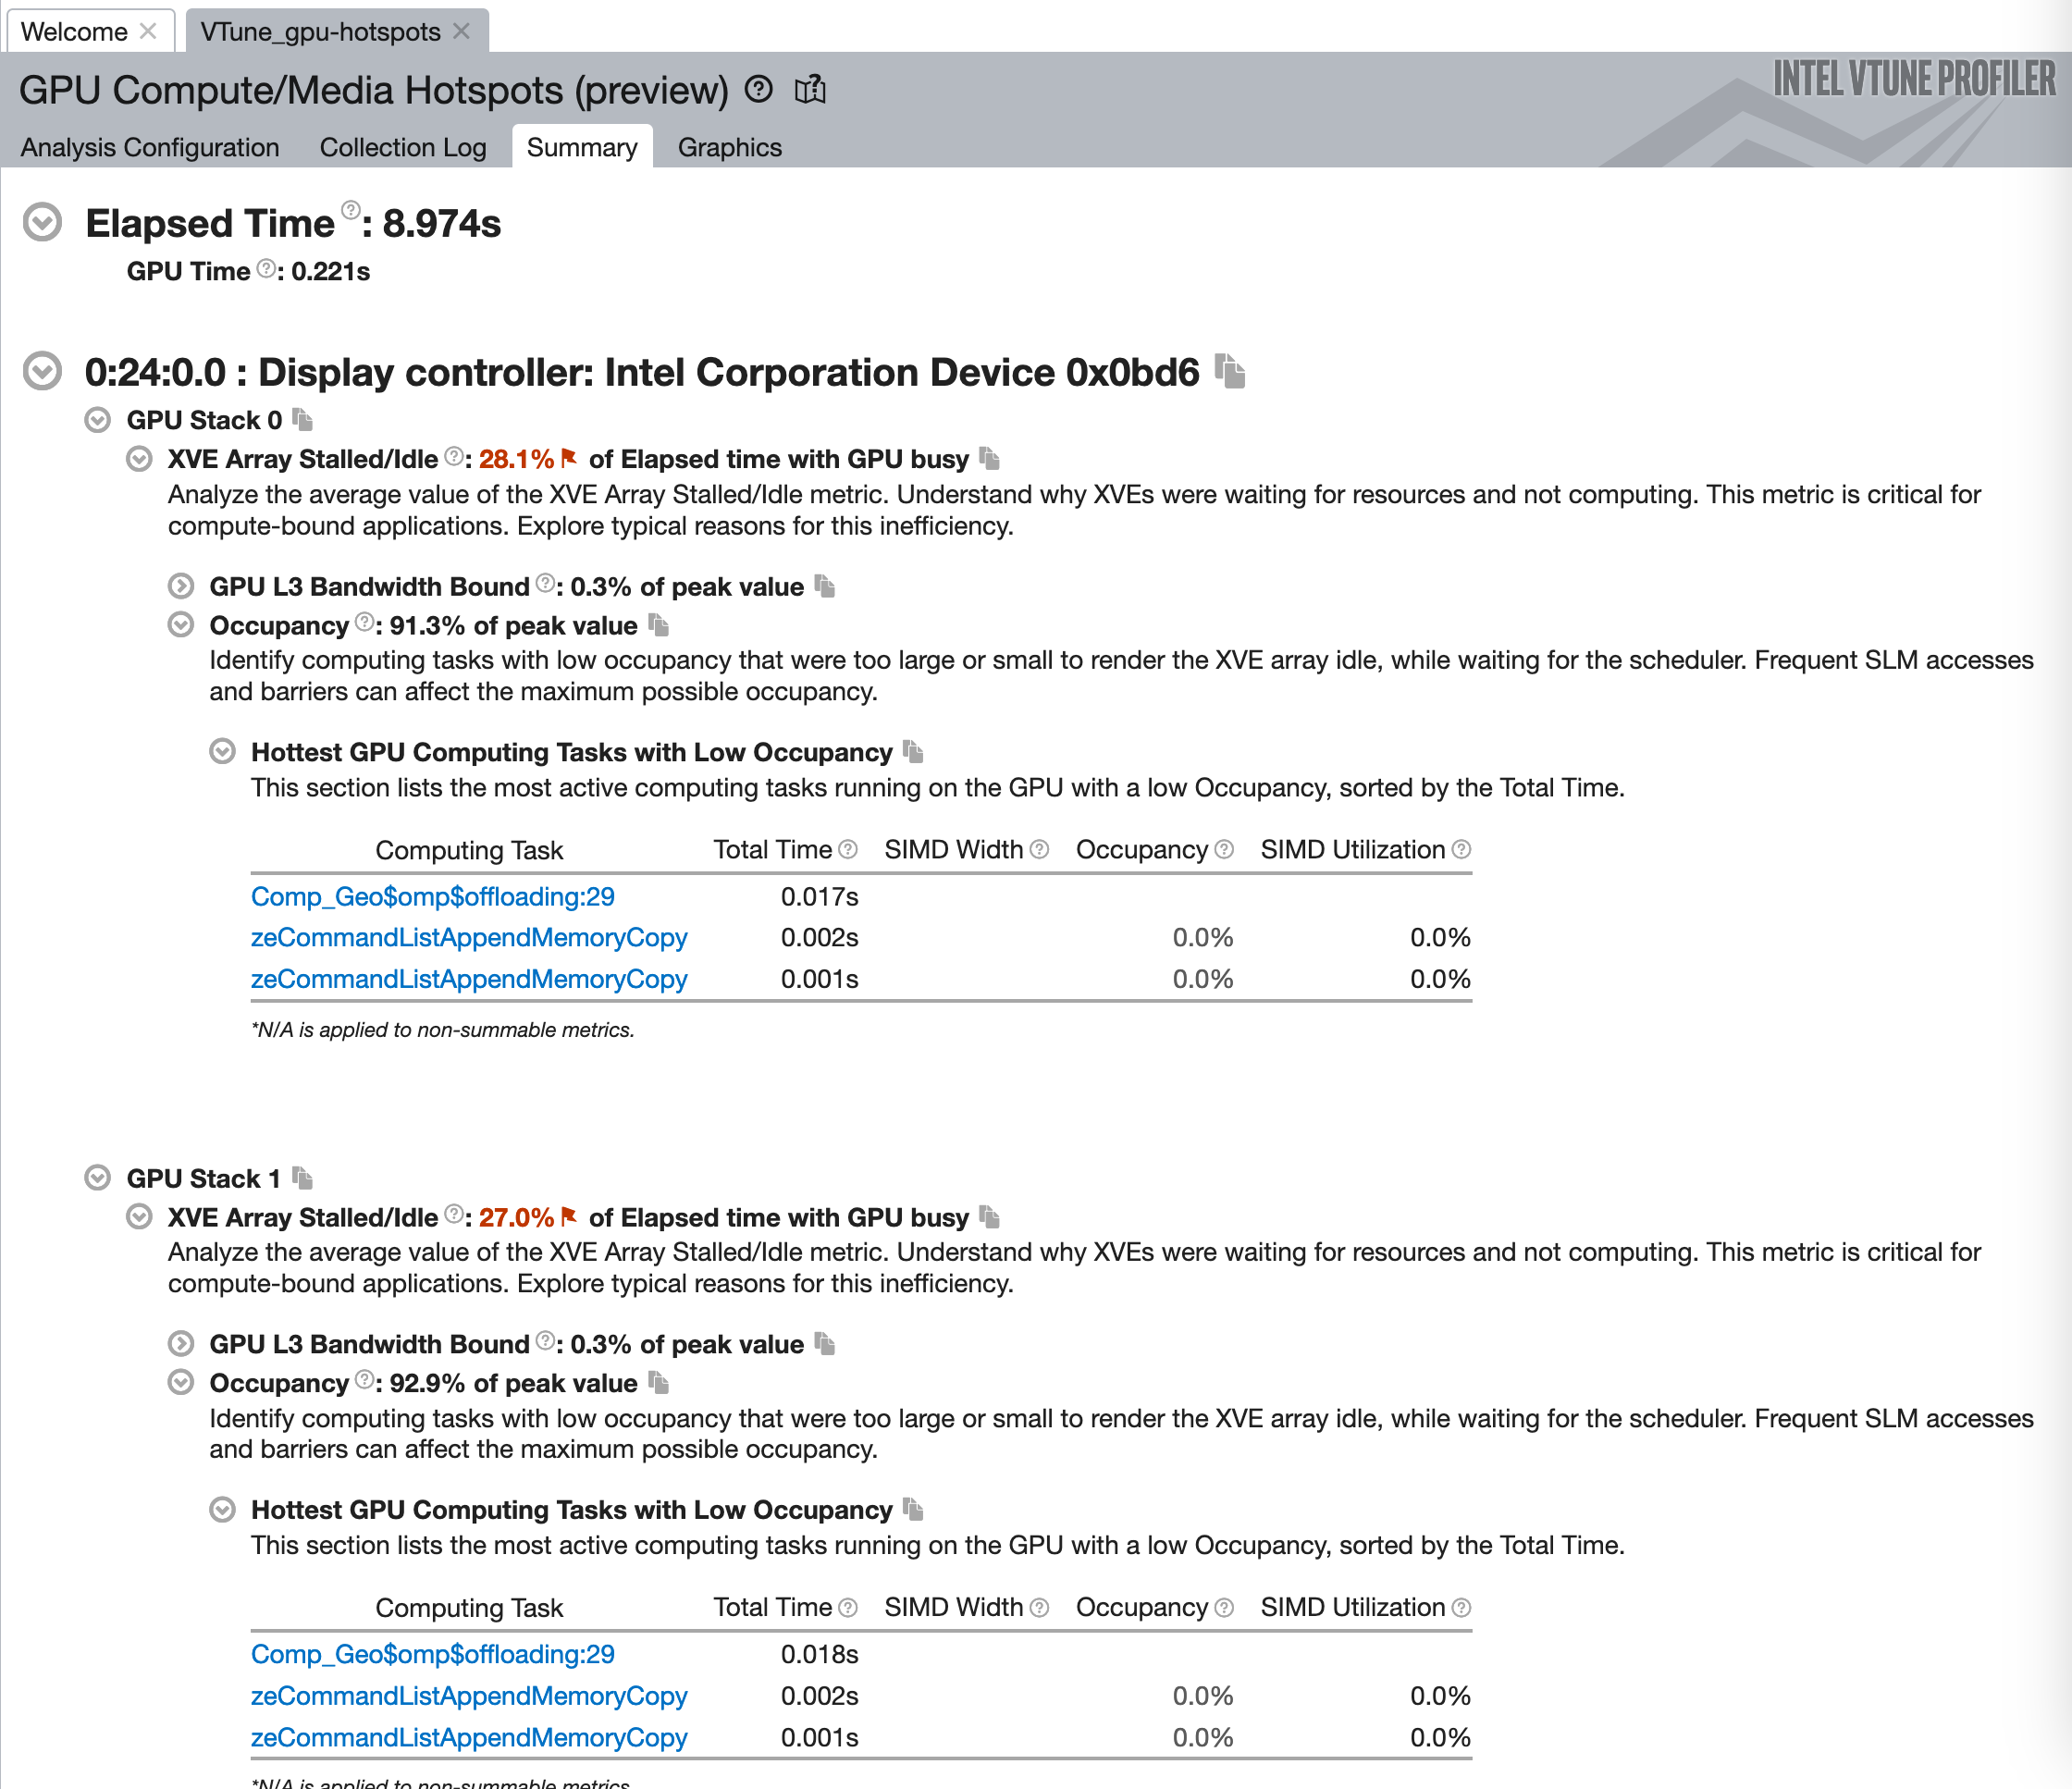
After successful VTune analysis, VTune provides Hottest GPU Computing Tasks with High Sampler Usage with non-zero data. The following is an example from a GeoSeries benchmark:
Hottest GPU Computing Tasks with High Sampler Usage
Computing Task                                                                                                                         Total Time
-------------------------------------------------------------------------------------------------------------------------------------  ----------
Comp_Geo(cl::sycl::queue, double*, double*, int, int)::{lambda(cl::sycl::handler&)#1}::operator()(cl::sycl::handler&) const::Comp_Geo      0.627s
zeCommandListAppendMemoryCopy
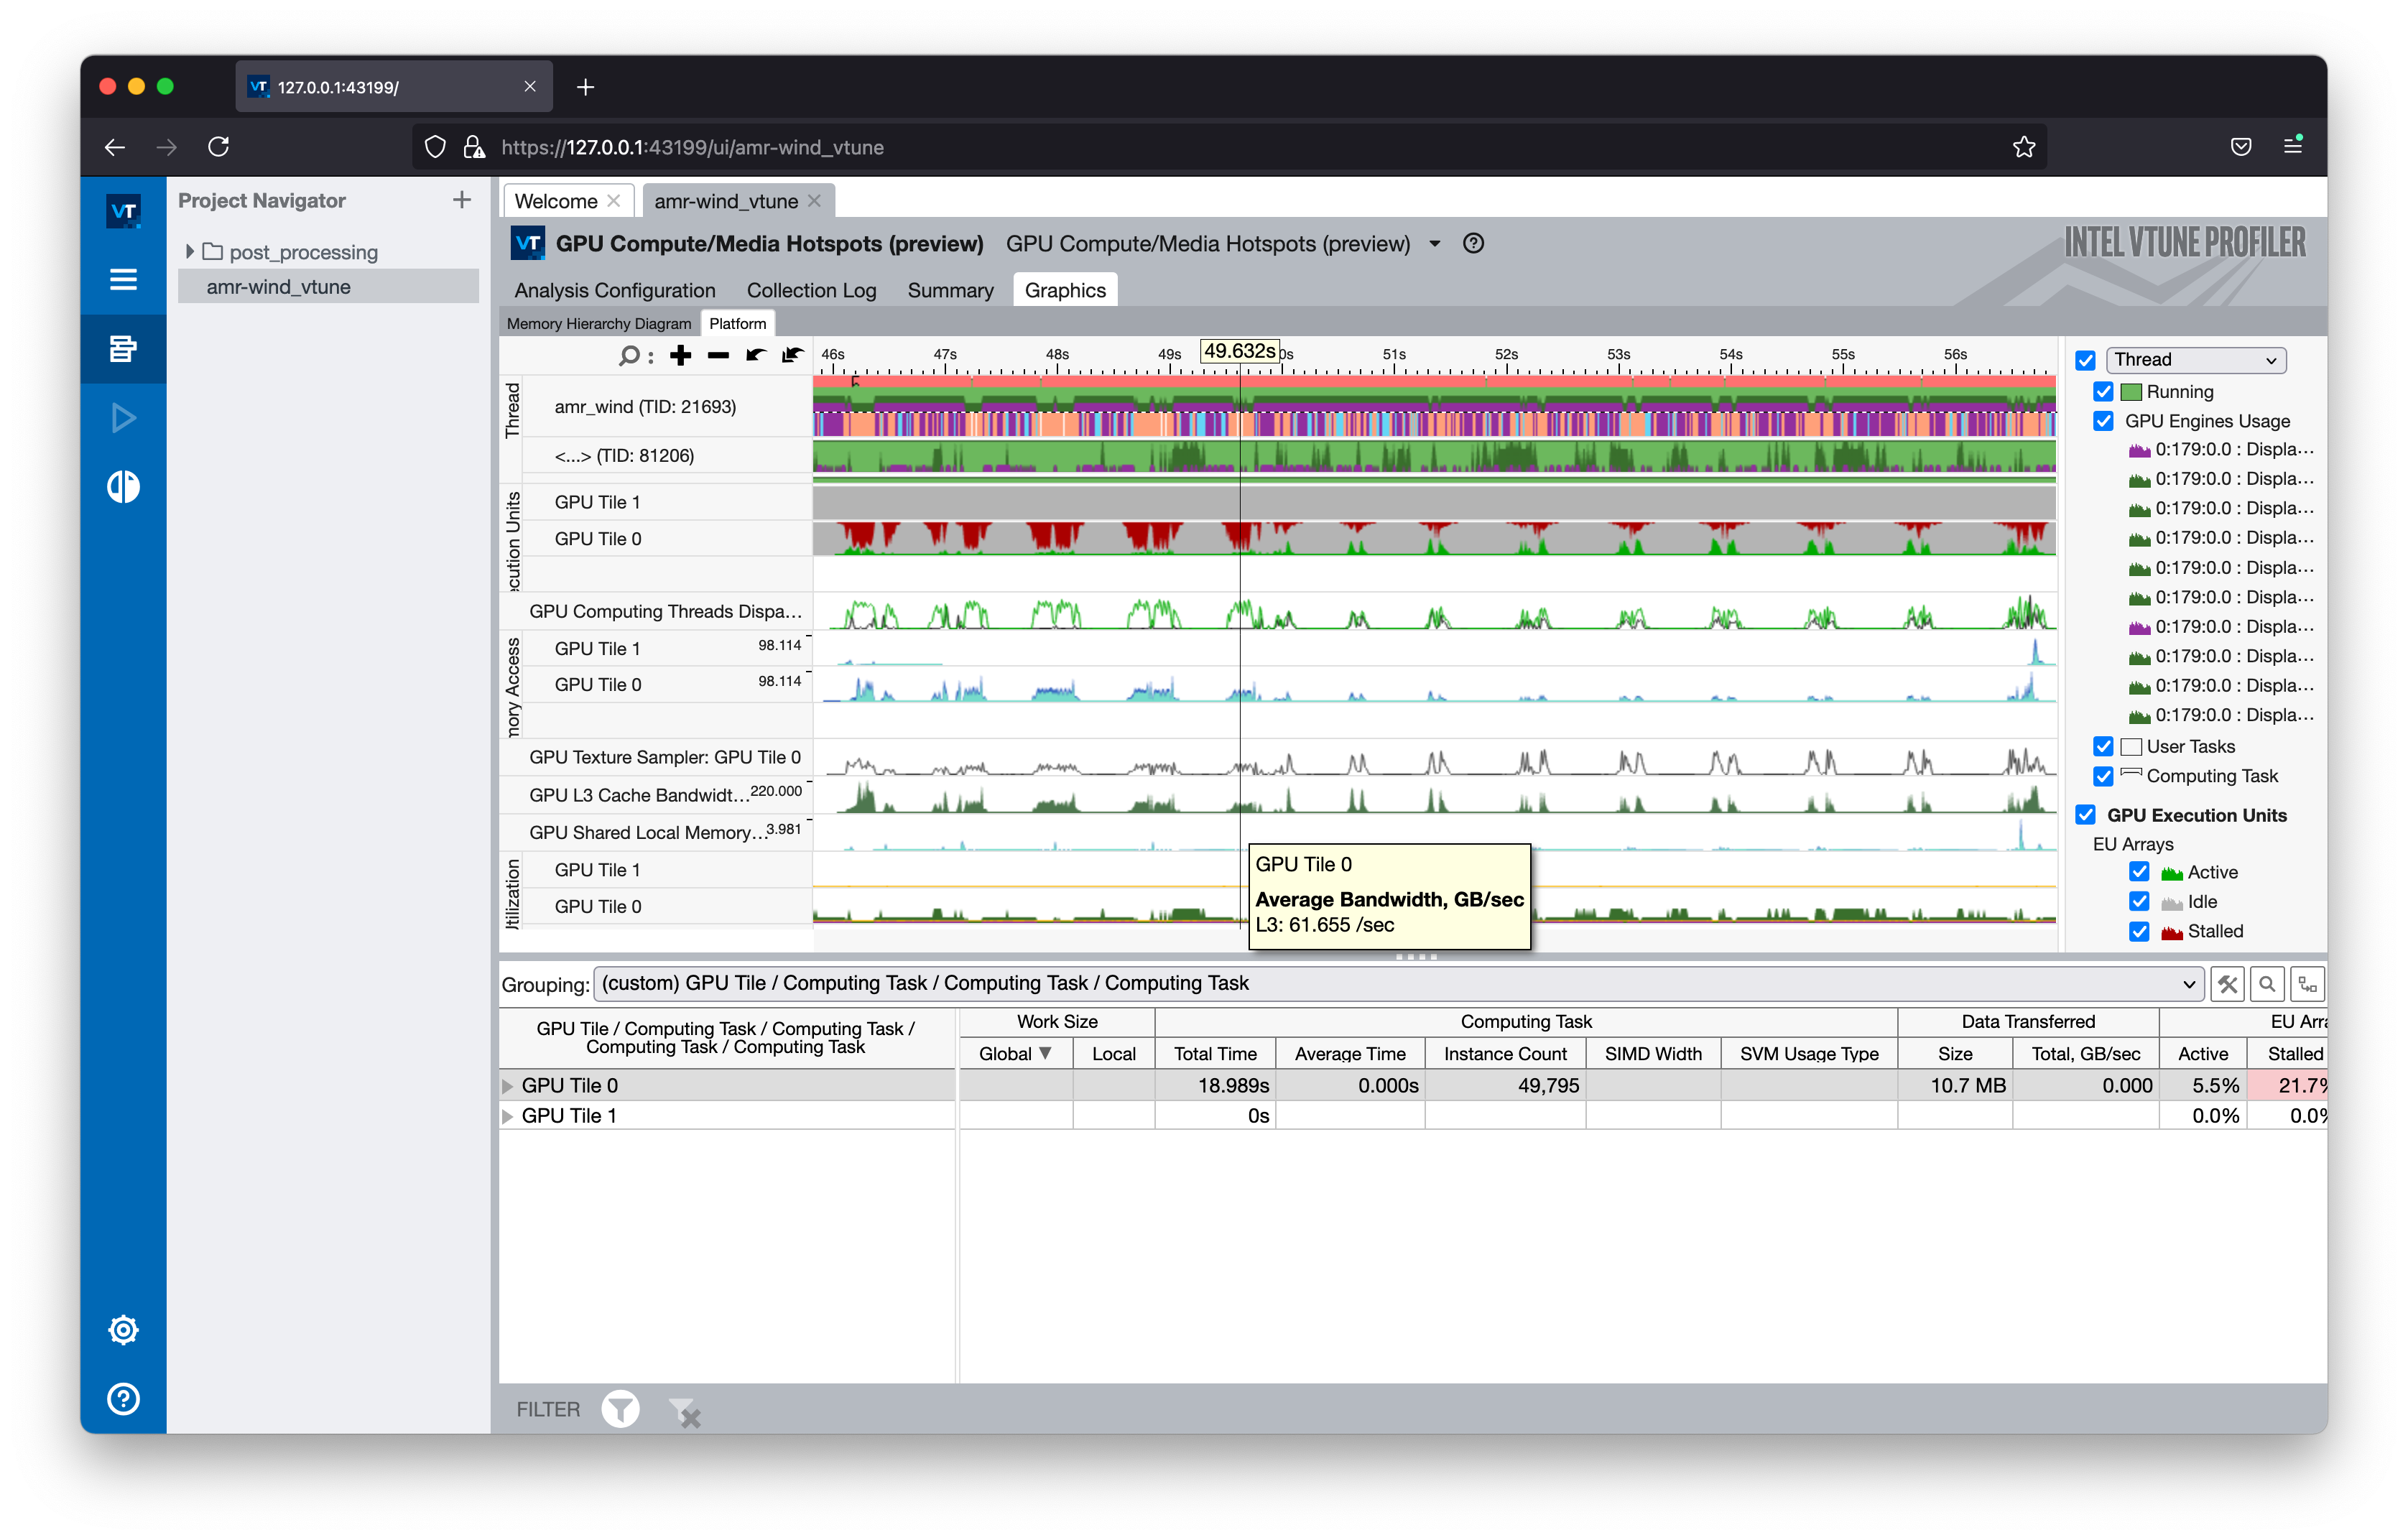
After collecting the performance data, VTune profiler web server can be used for the post-processing.
Step 1: Open a new terminal and log into Sunspot login node (no X11 forwarding required)
Step 2: Start VTune server on a Sunspot login node after loading oneapi module and setting corresponding environmental variables for VTune Step 3: Open a new terminal with SSH port forwarding enabled (need 2 hops)$ ssh -L 127.0.0.1:<port printed by vtune-backend>:127.0.0.1:<port printed by vtune-backend> <username>@bastion.alcf.anl.gov
$ ssh -L 127.0.0.1:<port printed by vtune-backend>:127.0.0.1:<port printed by vtune-backend> <username>@login.aurora.alcf.anl.gov
Step 4: Check if the login nodes of Step 2 and Step 3 are the same or not. If not (e.g., aurora-uan-0009 from Step 2 and aurora-uan-0010 from Step 3), do ssh on the terminal for Step 3 to the login node of Step 2
$ ssh -L 127.0.0.1:<port printed by vtune-backend>:127.0.0.1:<port printed by vtune-backend> aurora-uan-xxxx
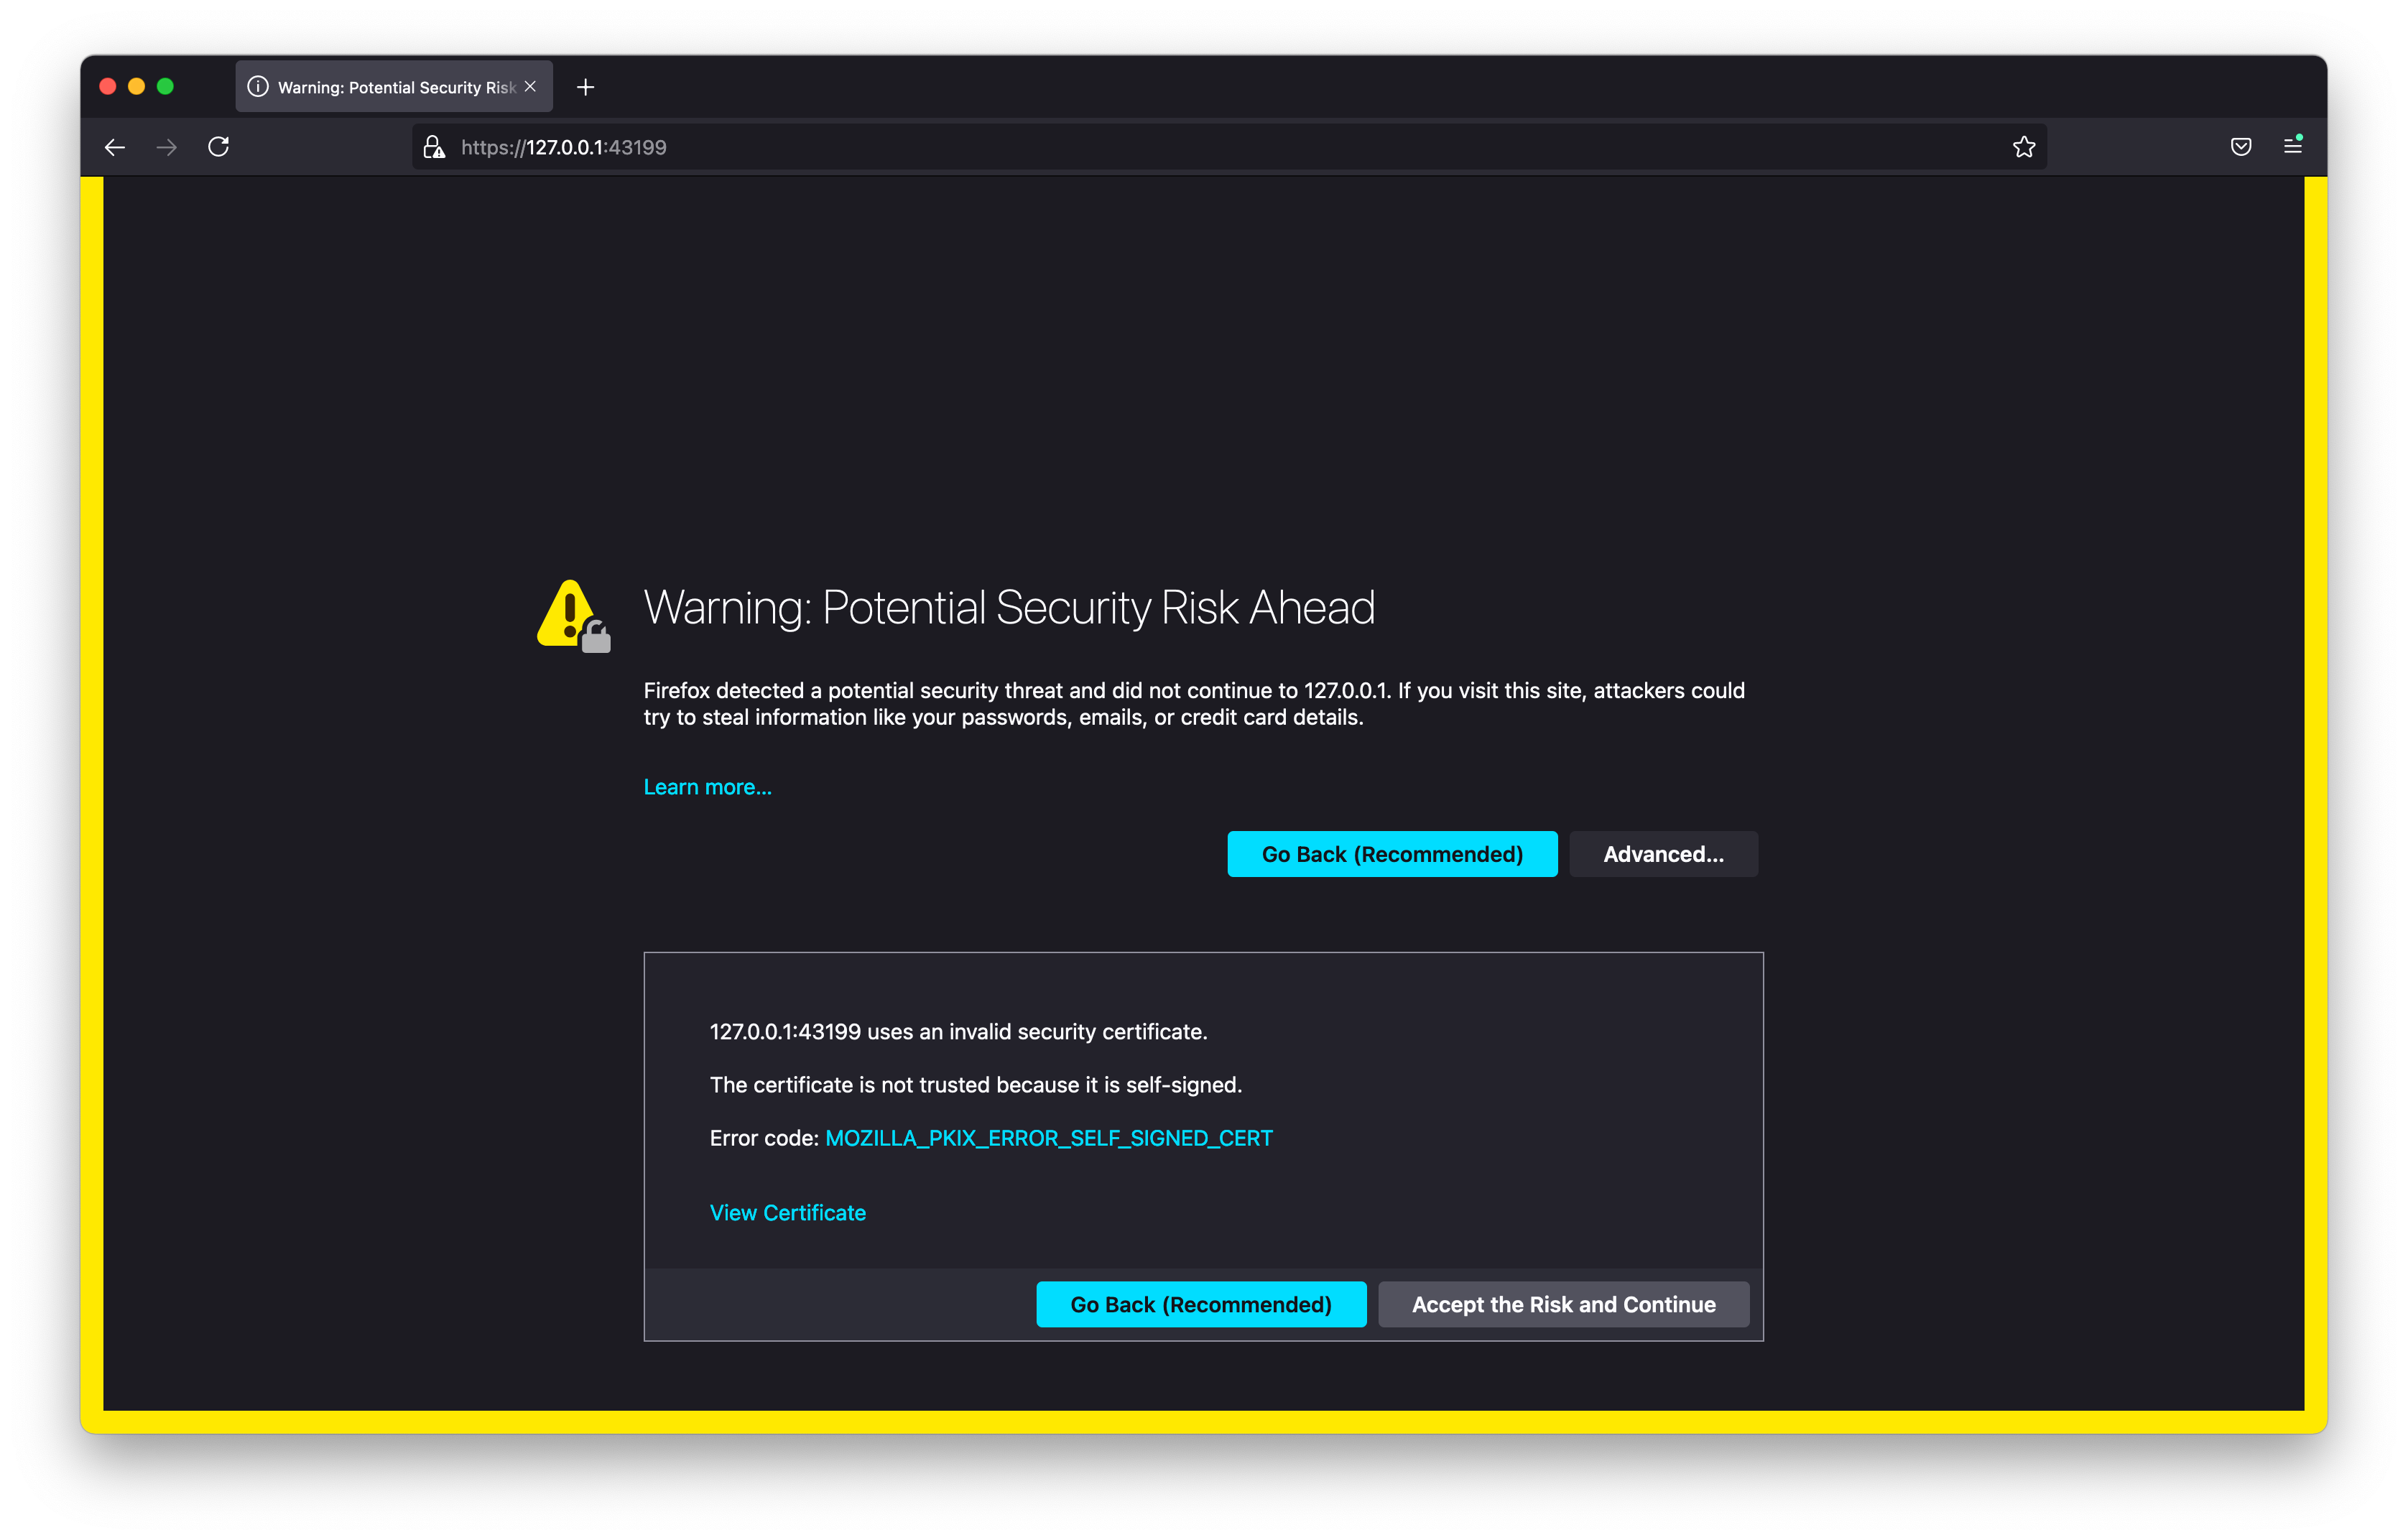
Step 5: Open the URL printed by VTune server in firefox web browser on your local computer. For a security warning, click "Advanced..." and then "Accept the Risk and Continue".
-
Accept VTune server certificate: When you open VTune GUI, your web browser will complain about VTune self-signed certificate. You either need to tell web browser to proceed or install VTune server certificate on you client machine so that browser trusts it. To install the certificate note the path to the public part of the certificate printed by VTune server in the output, copy it to you client machine and add to the trusted certificates.
-
Set the passphrase: When you run the server for the first time the URL that it outputs contains a one-time-token. When you open such URL in the browser VTune server prompts you to set a passphrase. Other users can't access your VTune server without knowing this passphrase. The hash of the passphase will be persisted on the server. Also, a secure HTTP cookie will be stored in your browser so that you do not need to enter the passphrase each time you open VTune GUI.
Simple examples
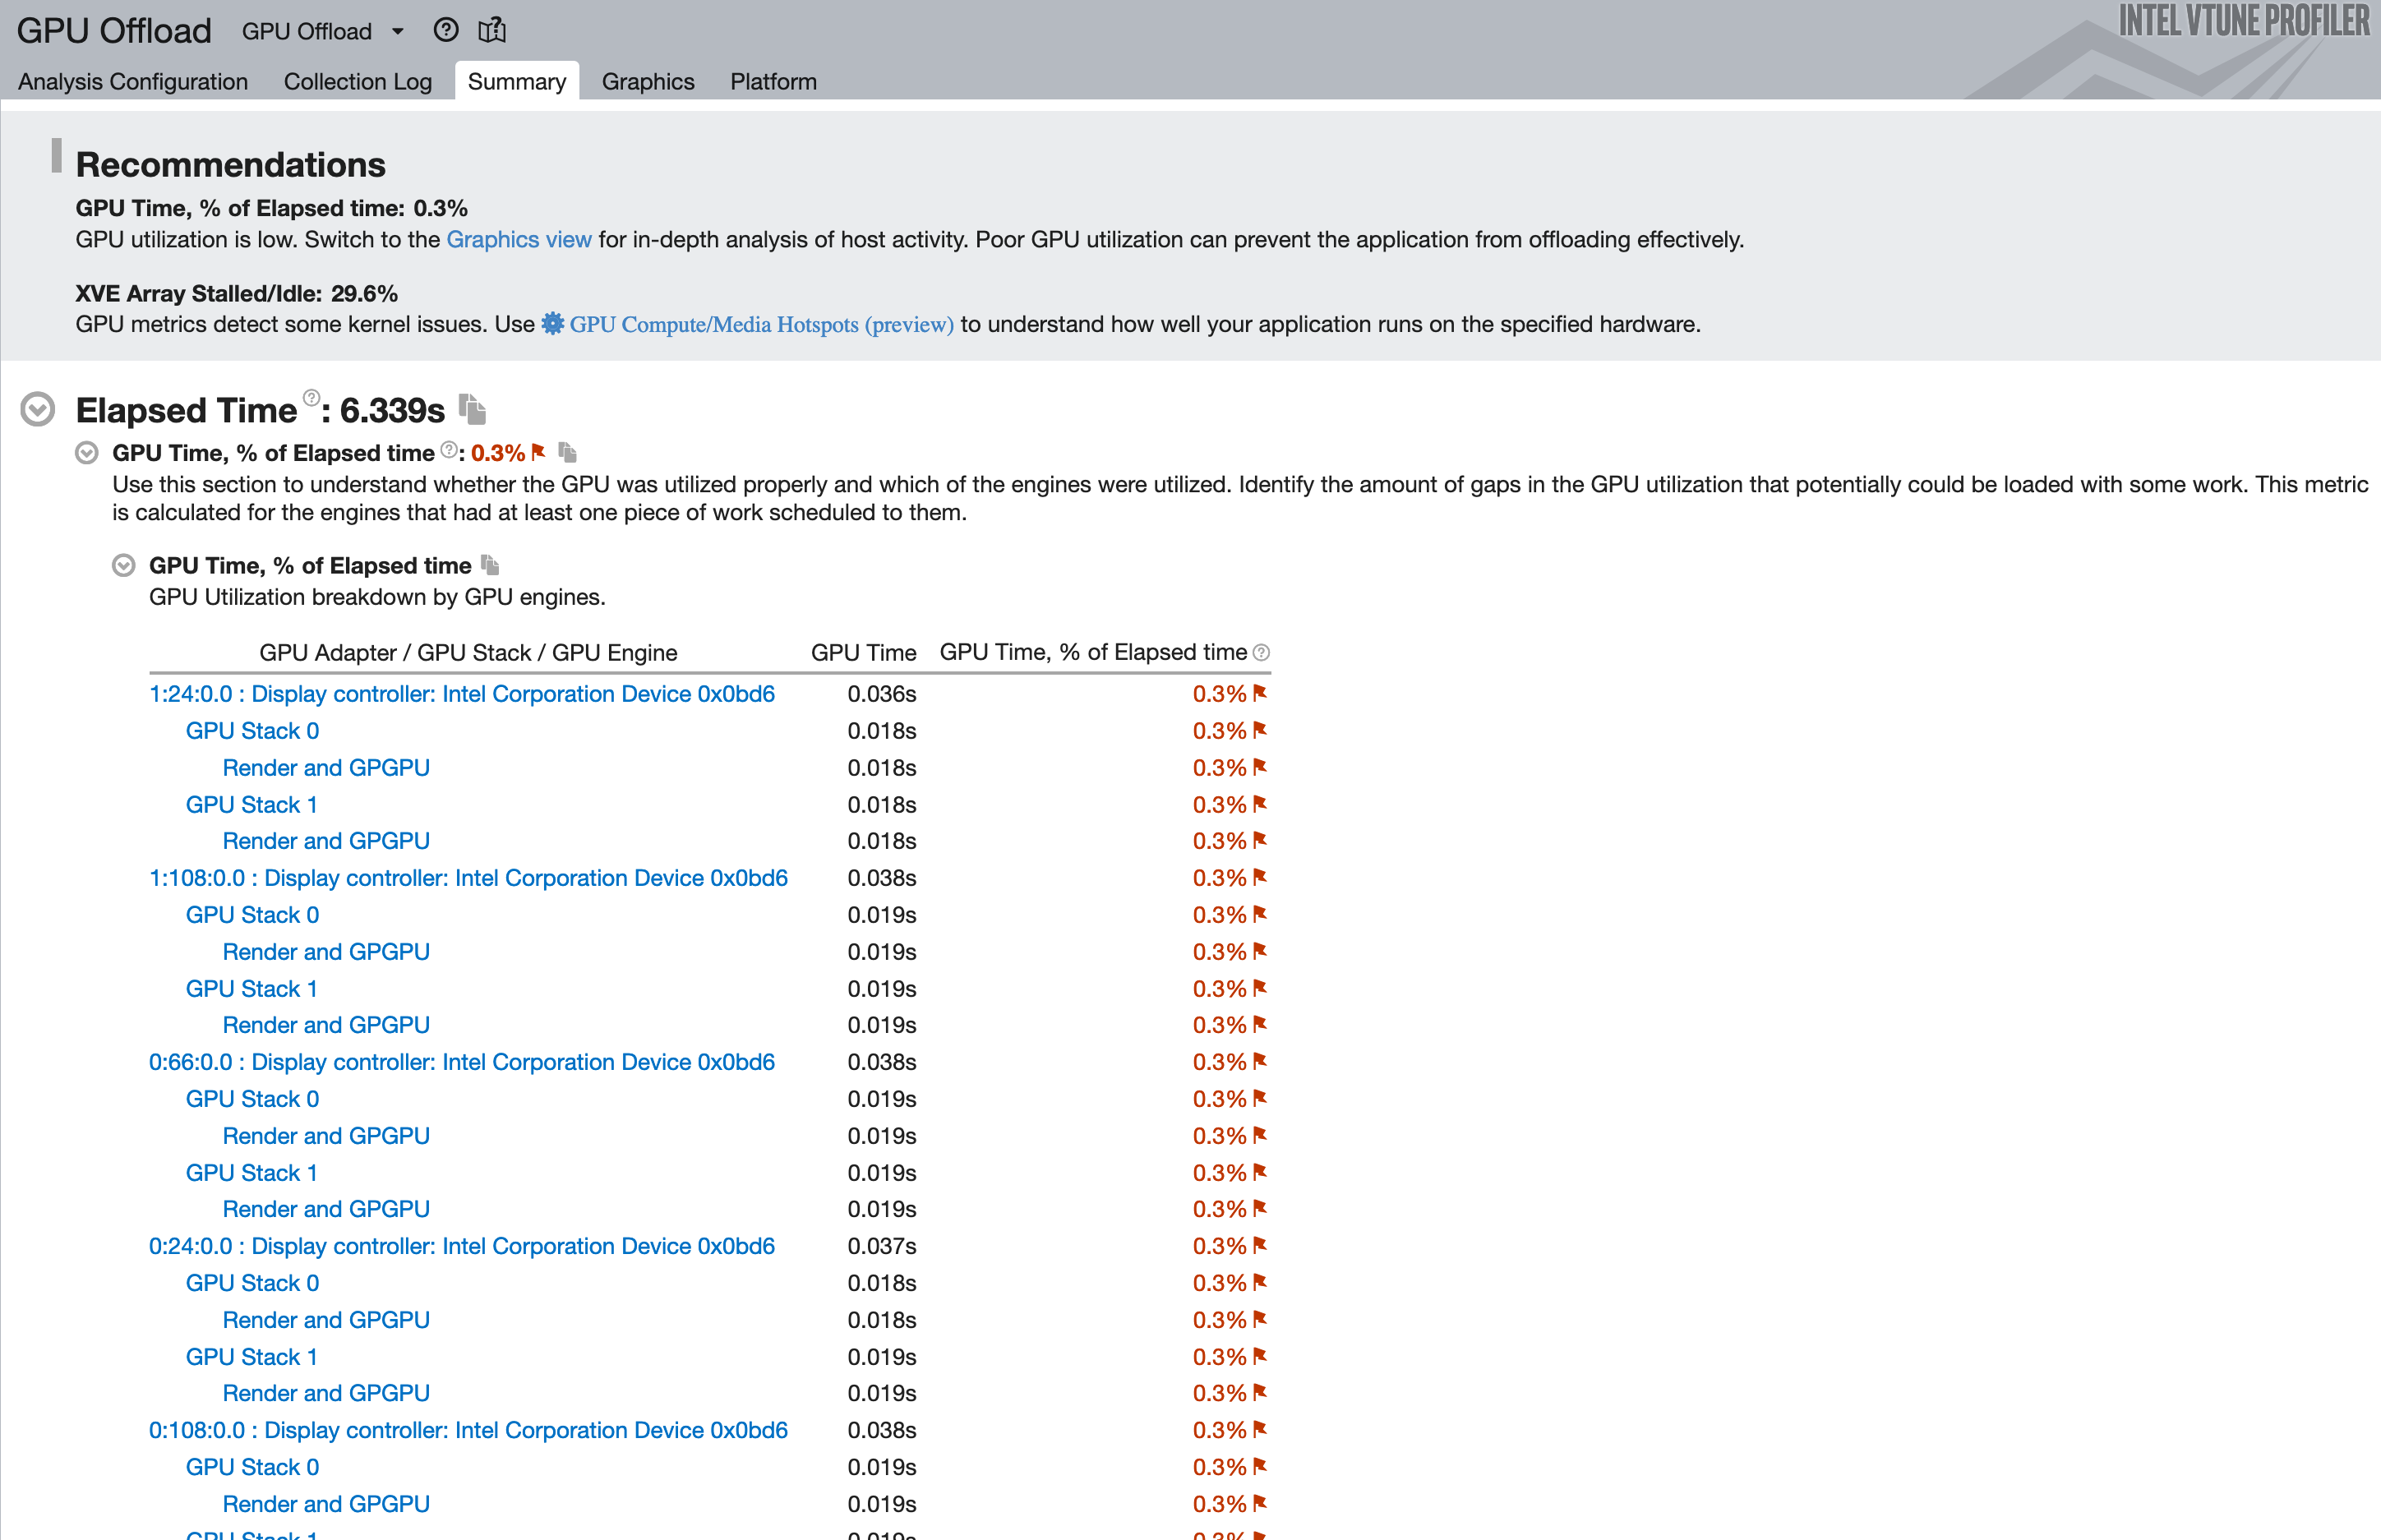
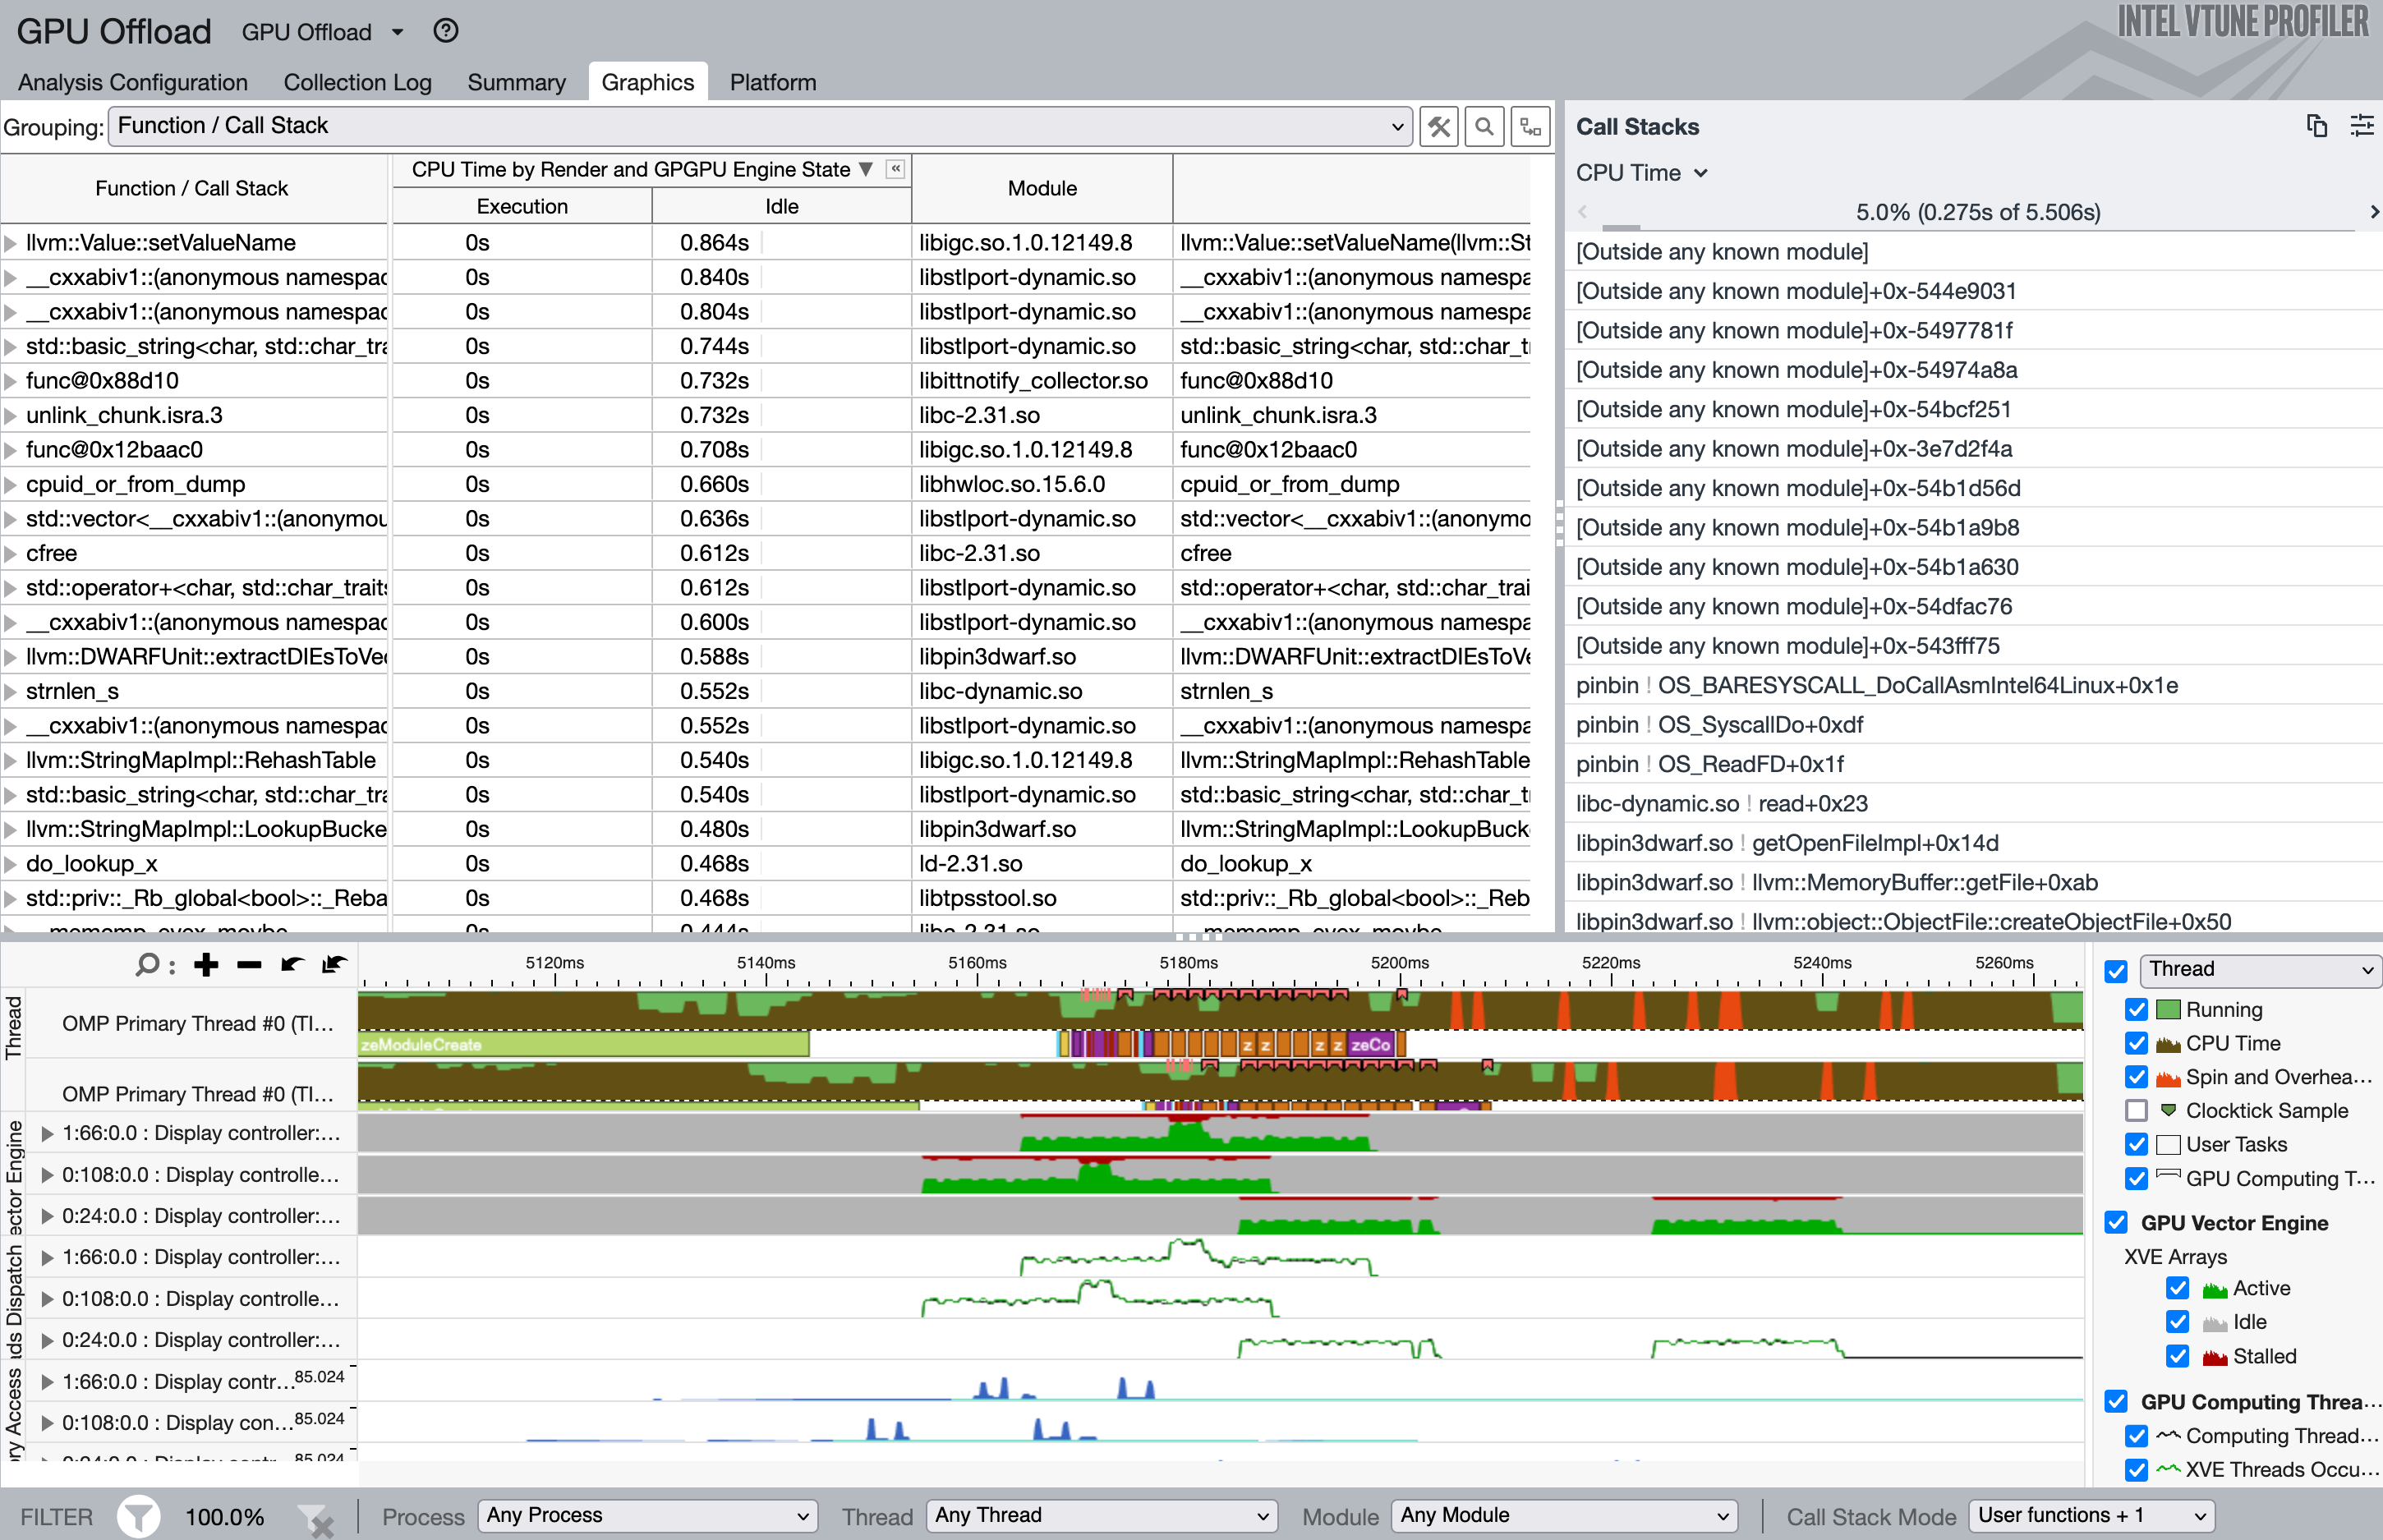
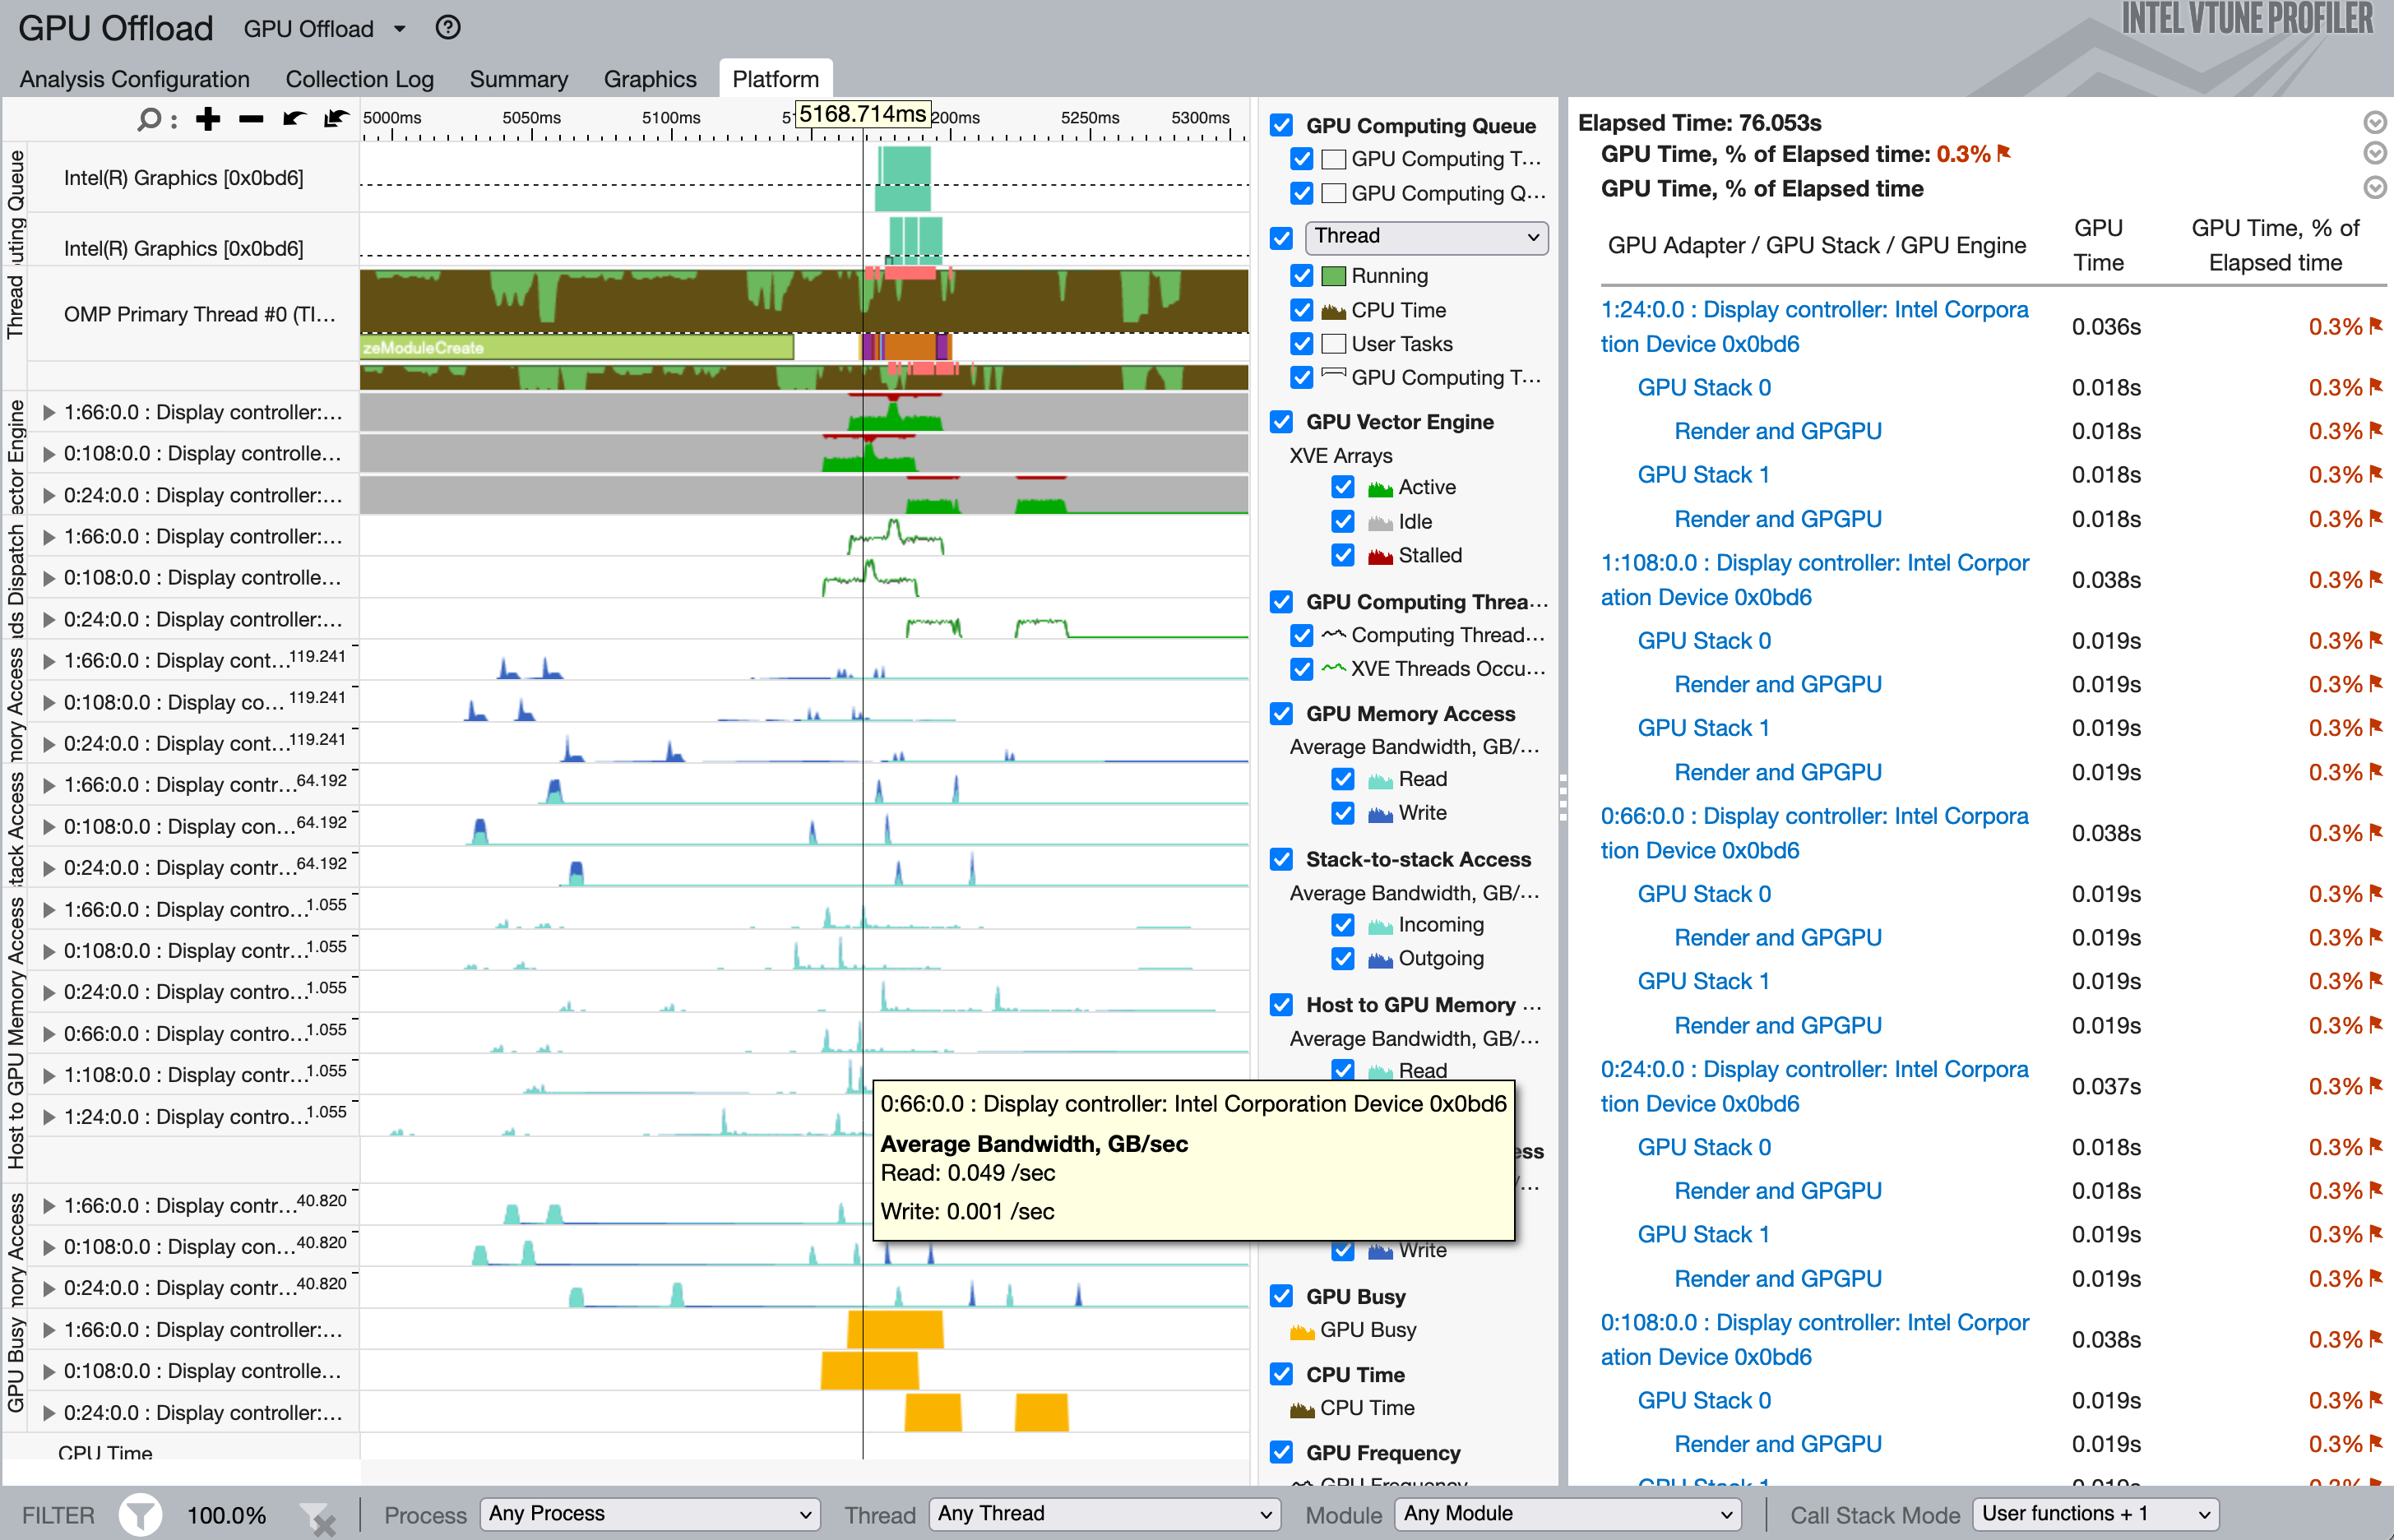
VTune gpu-offload analysis
$ mpiexec -n 12 gpu_tile_compact.sh vtune -collect gpu-offload -r VTune_gpu-offload ./Comp_GeoSeries_omp_mpicxx_DP 2048 1000
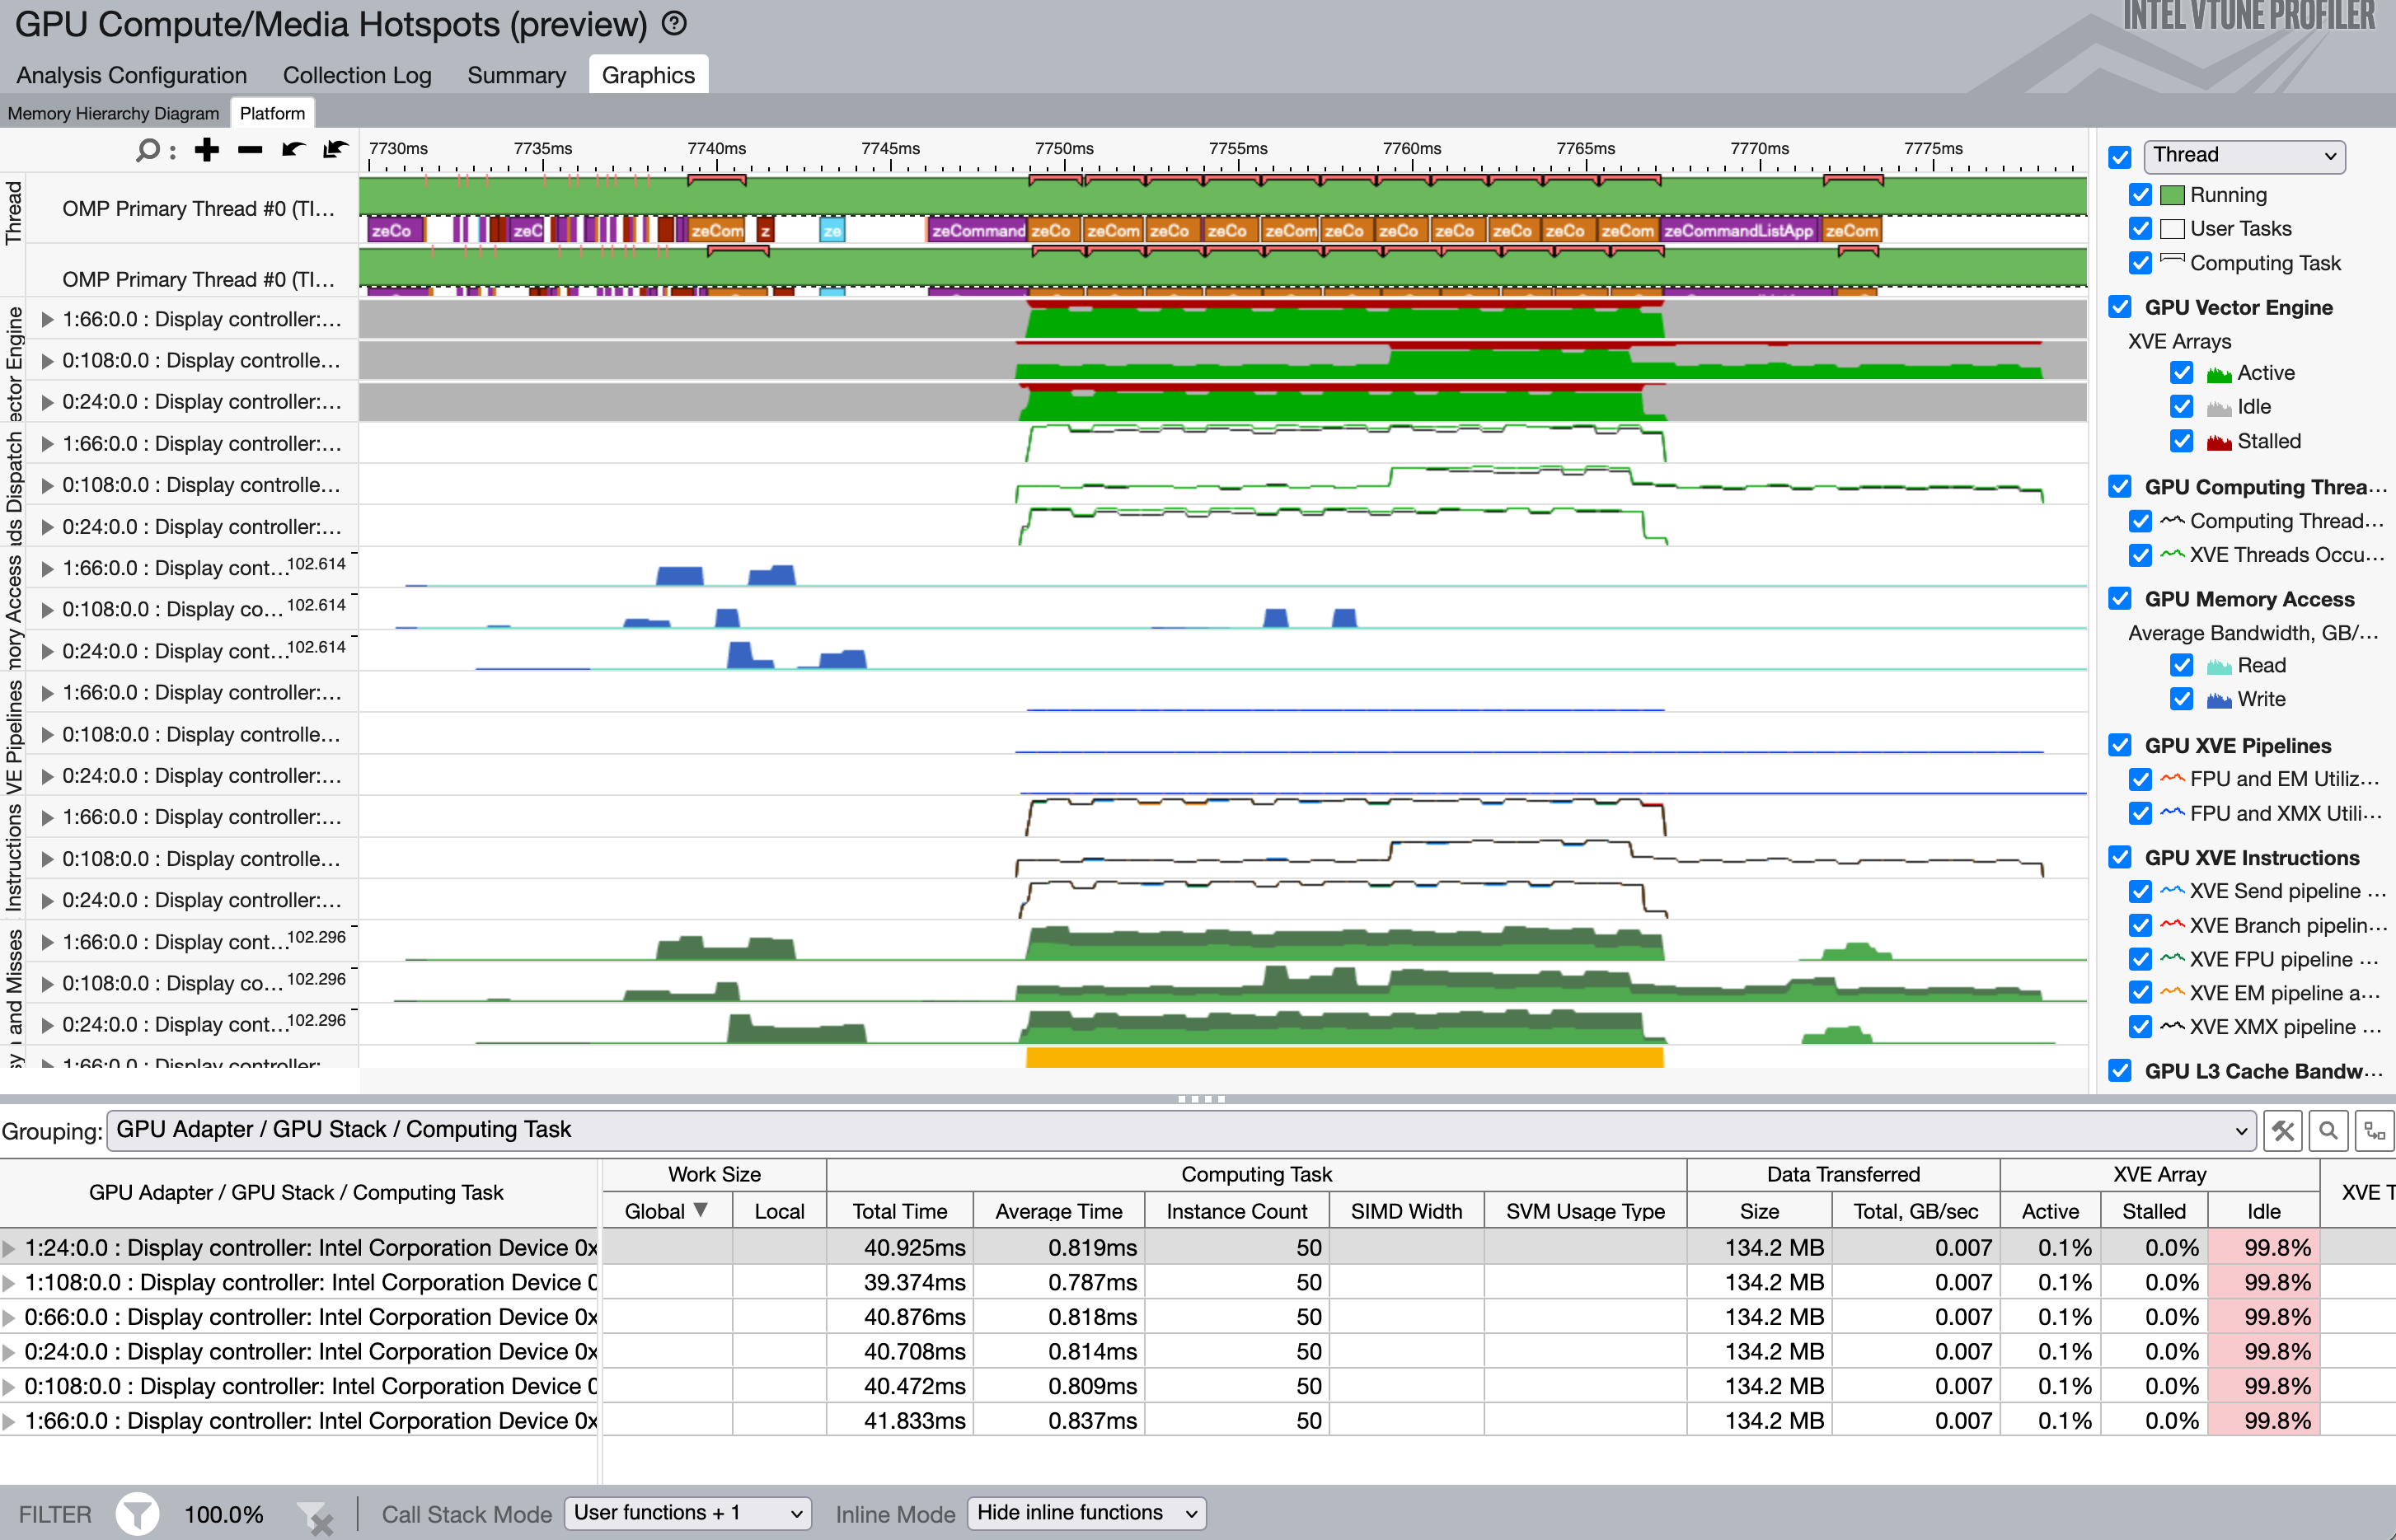
VTune gpu-hotspots analysis
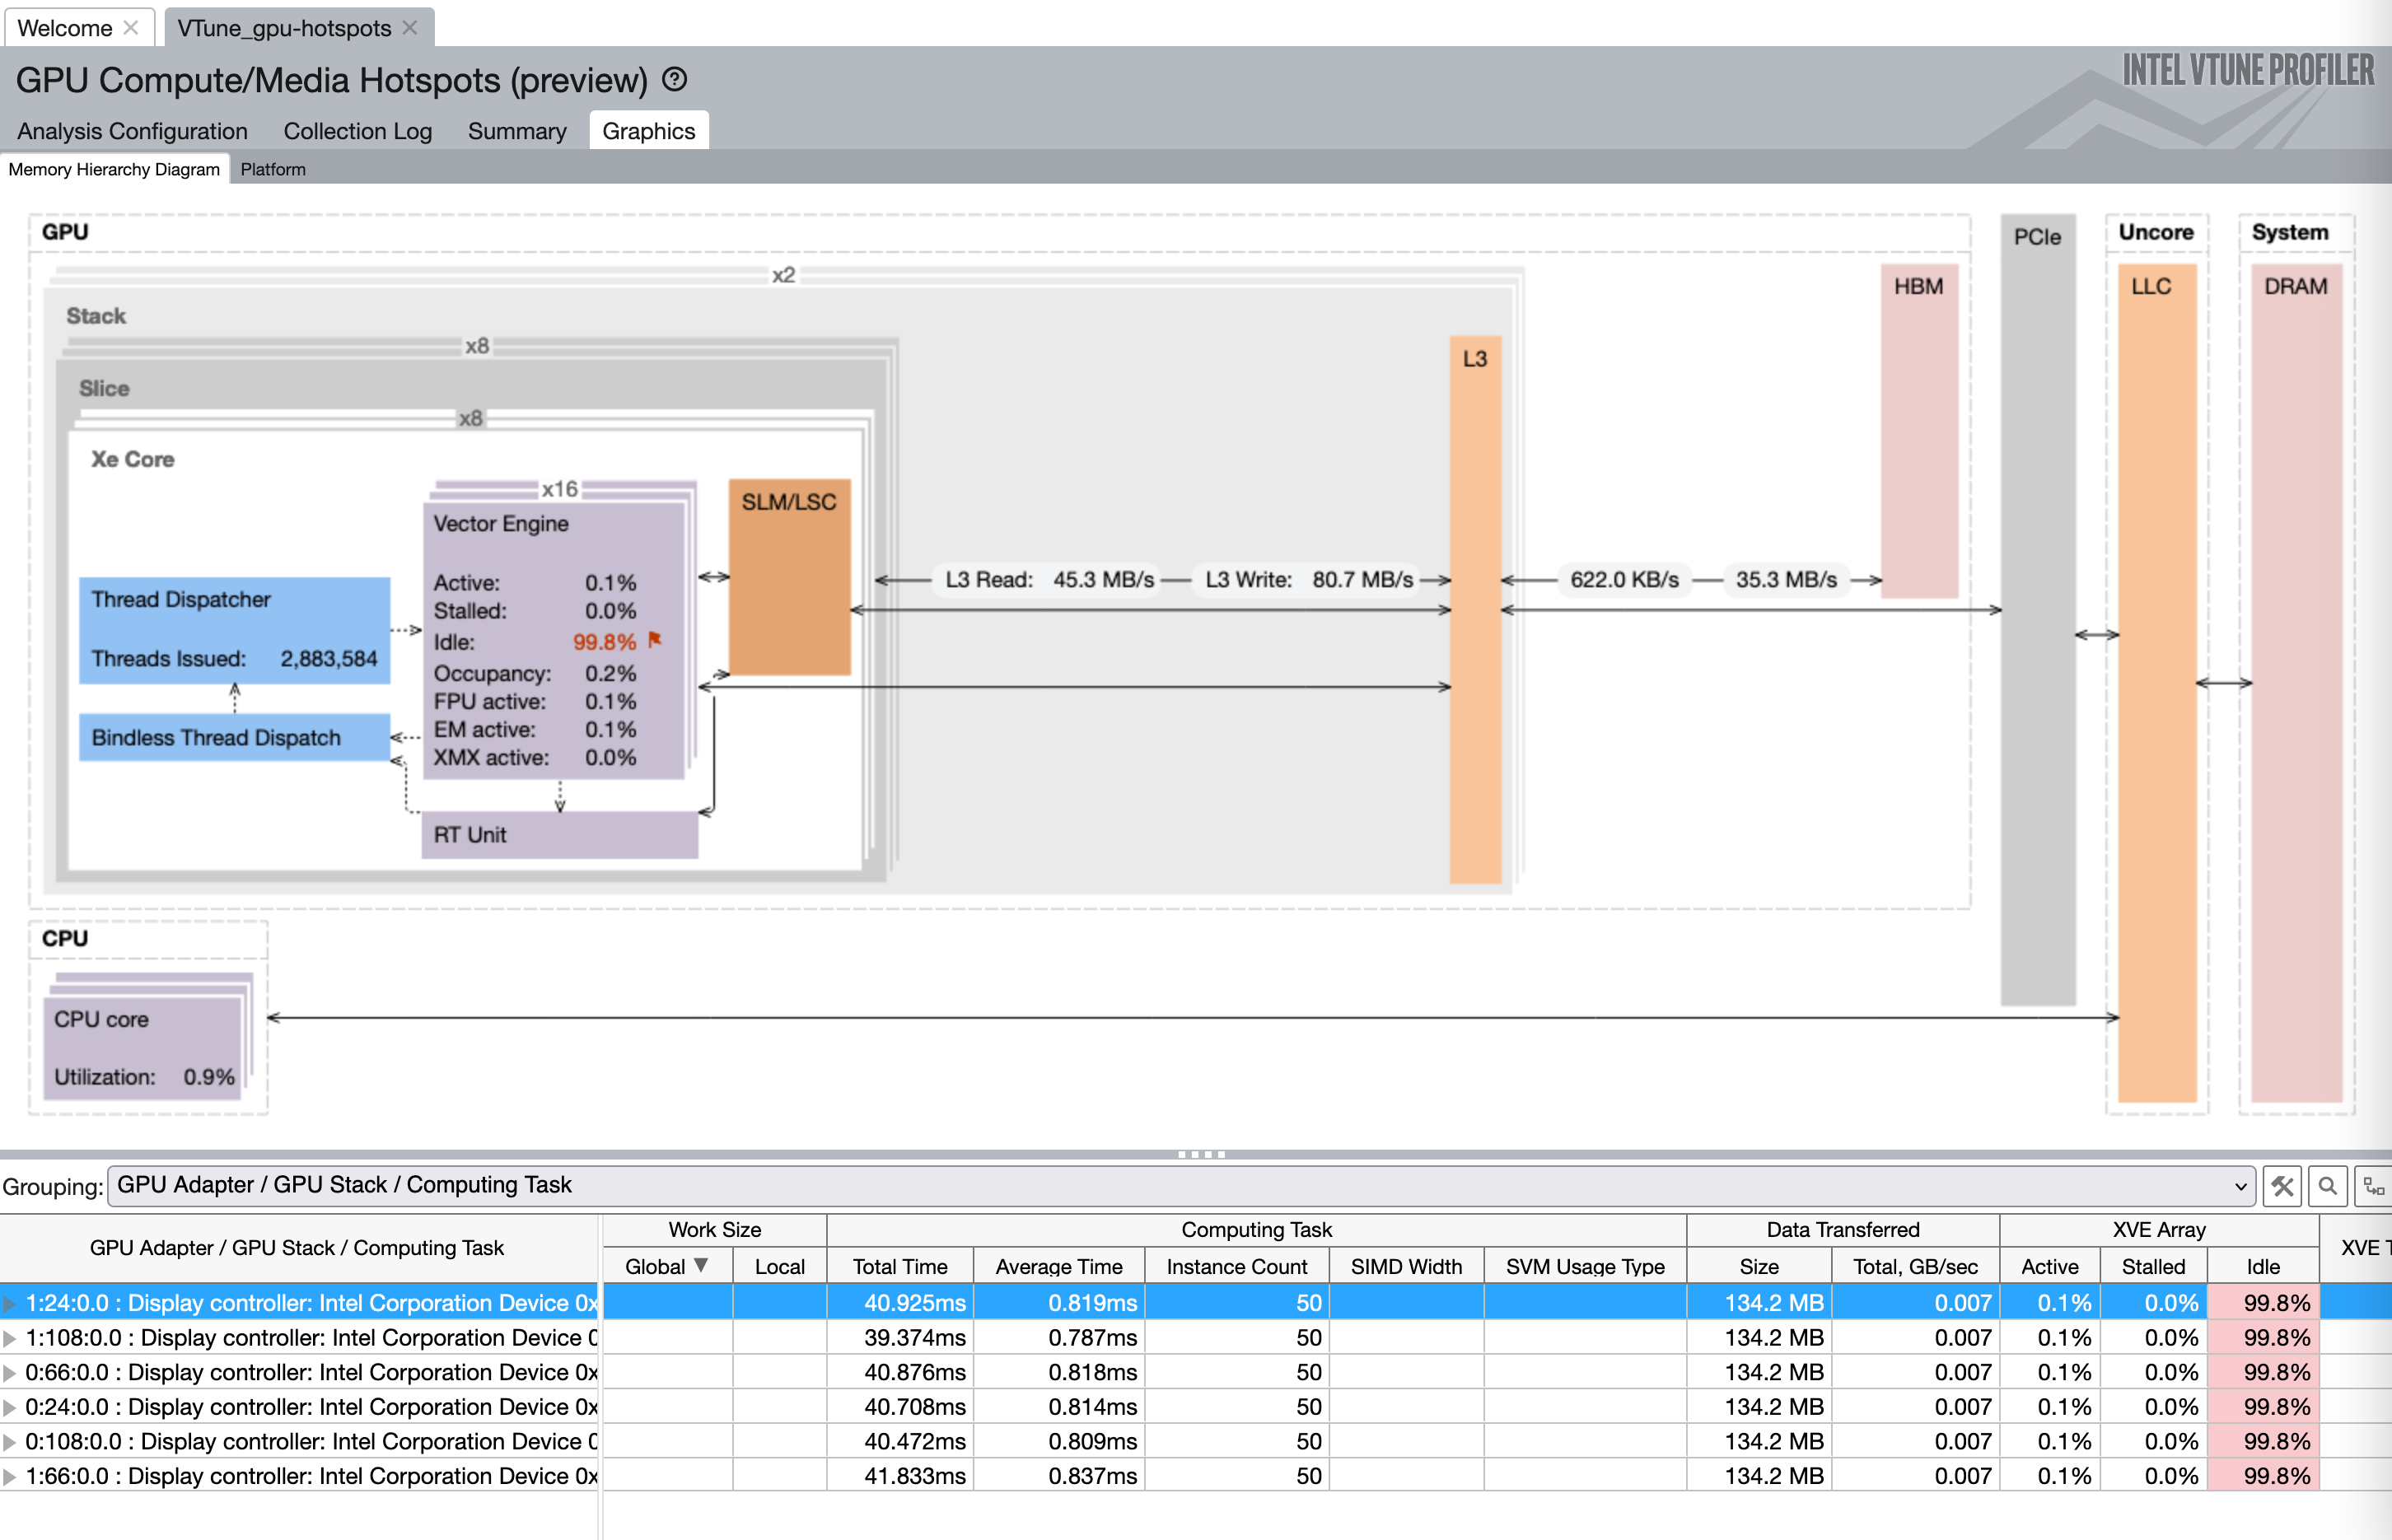
$ mpiexec -n 12 gpu_tile_compact.sh vtune -collect gpu-hotspots -r VTune_gpu-hotspots ./Comp_GeoSeries_omp_mpicxx_DP 2048 1000
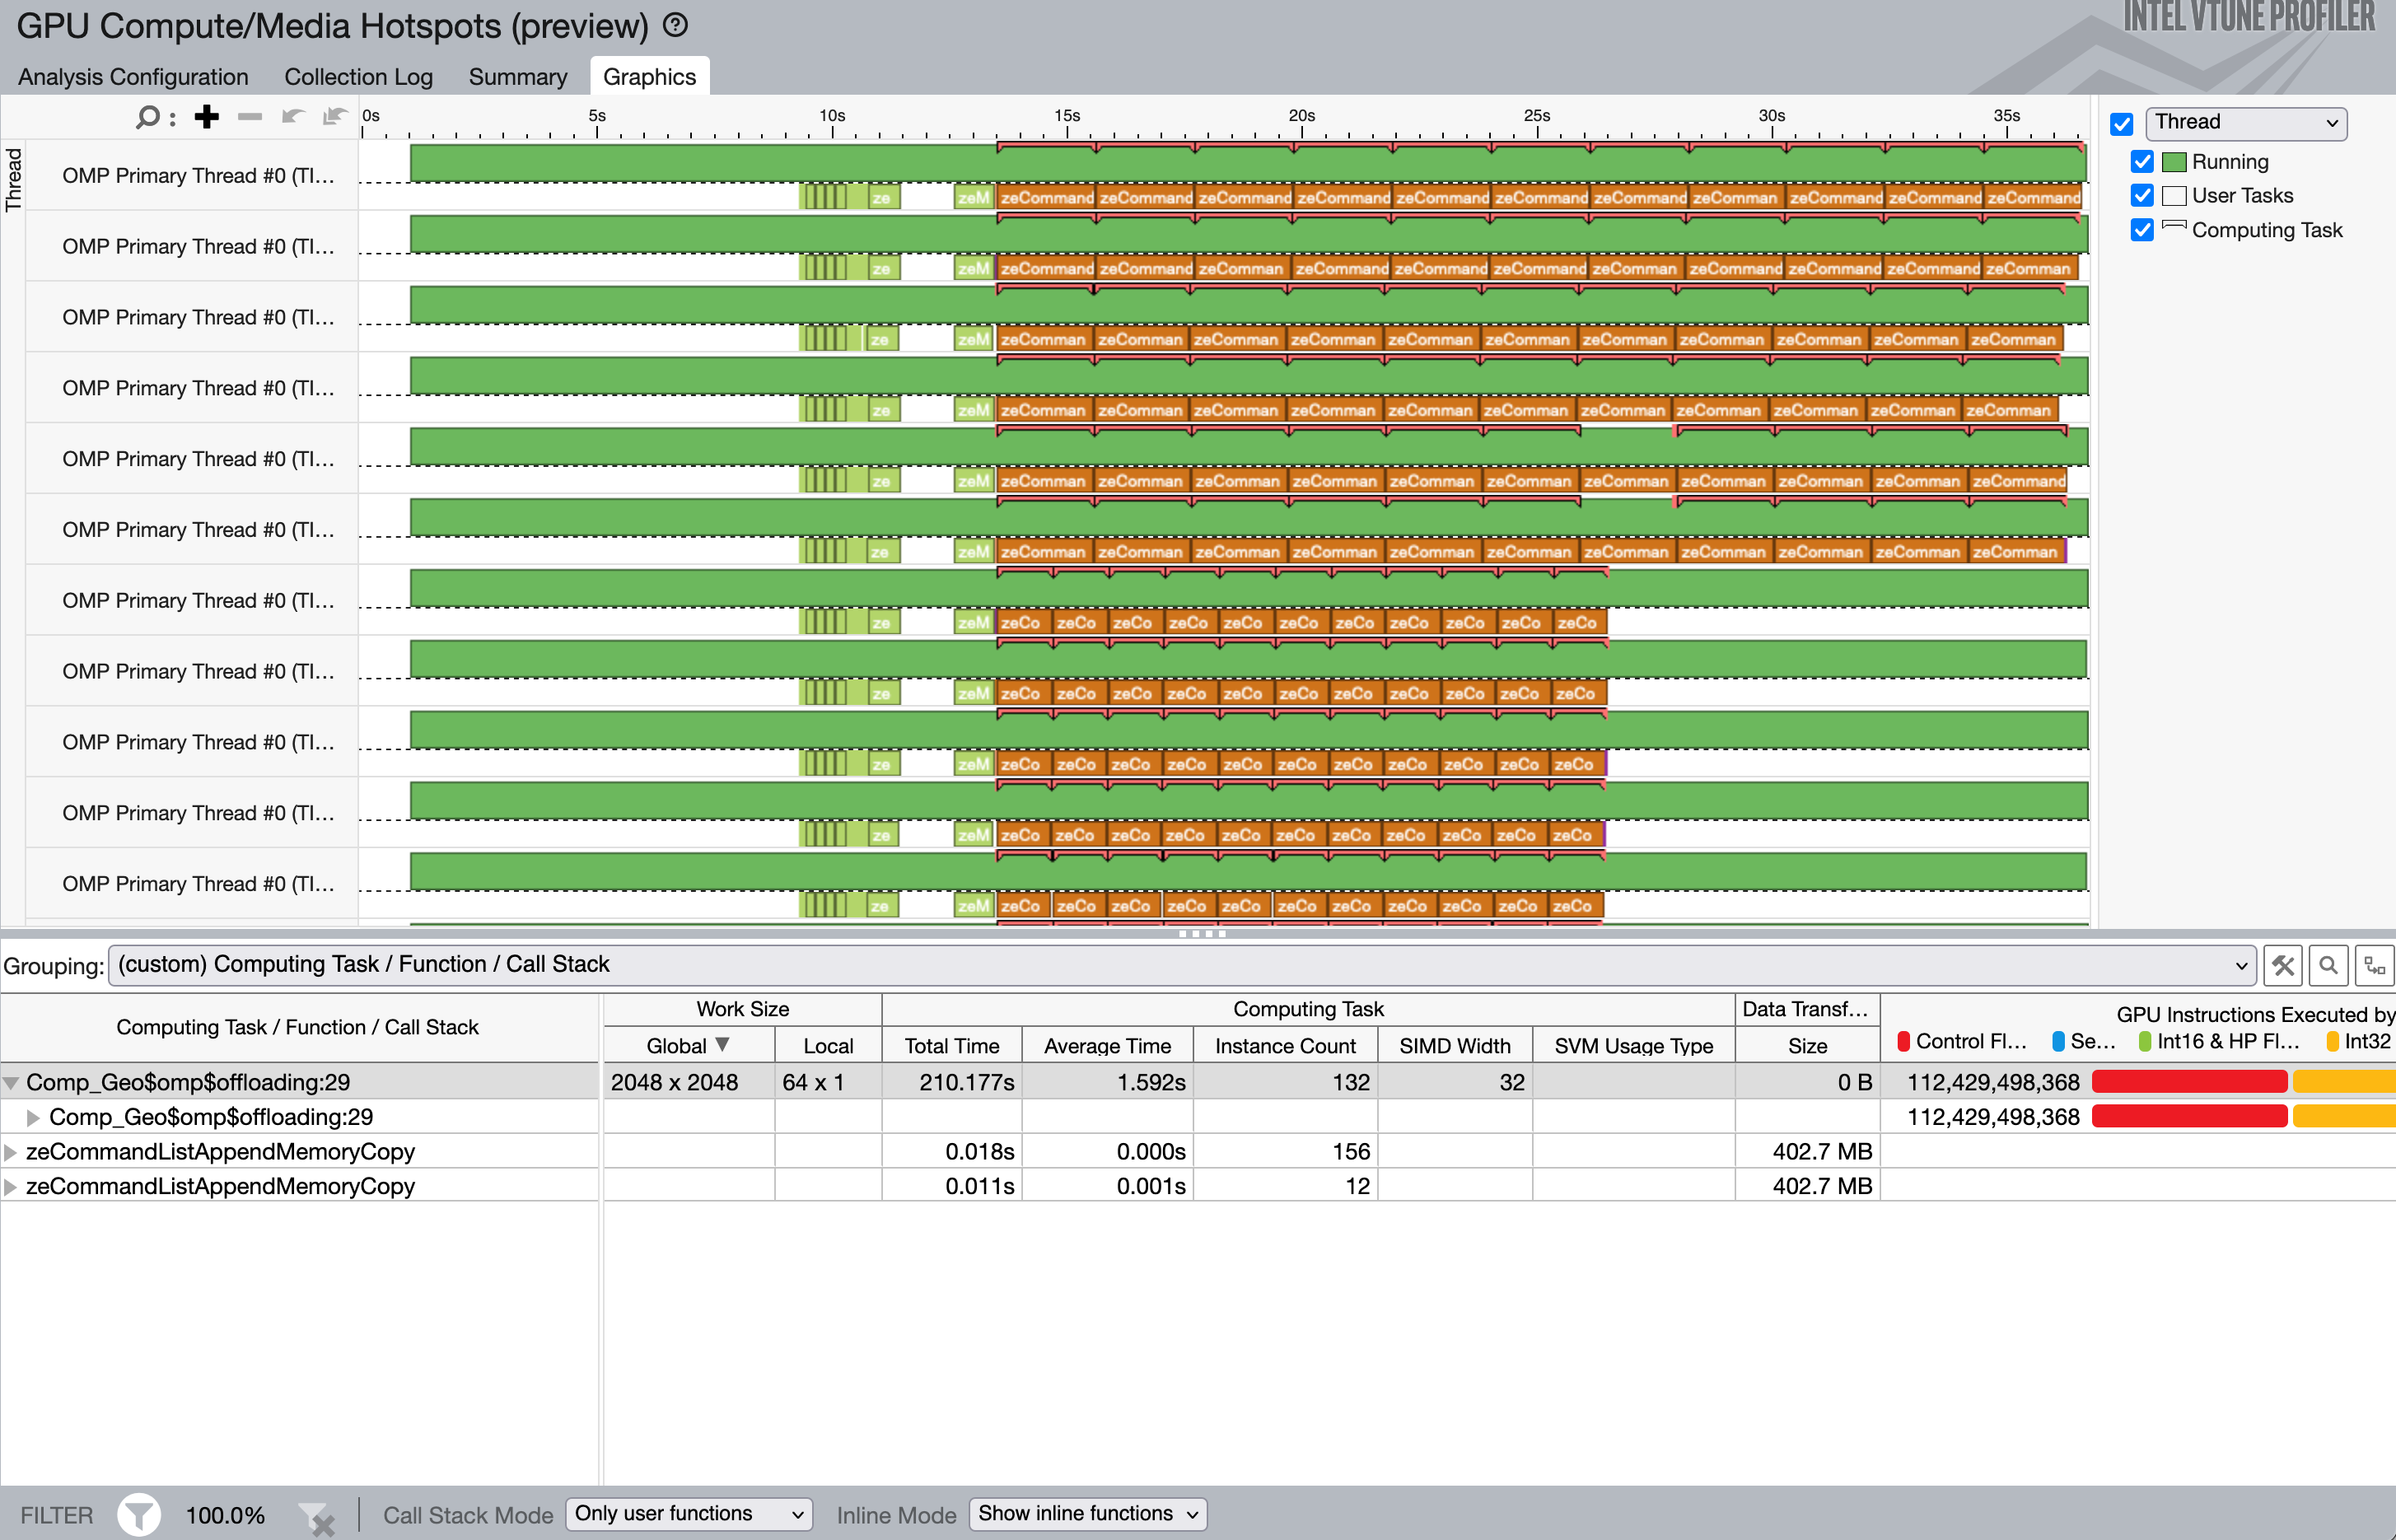
VTune instruction count analysis
$ mpiexec -n 12 gpu_tile_compact.sh vtune -collect gpu-hotspots -knob characterization-mode=instruction-count -r VTune_inst-count ./Comp_GeoSeries_omp_mpicxx_DP 2048 1000
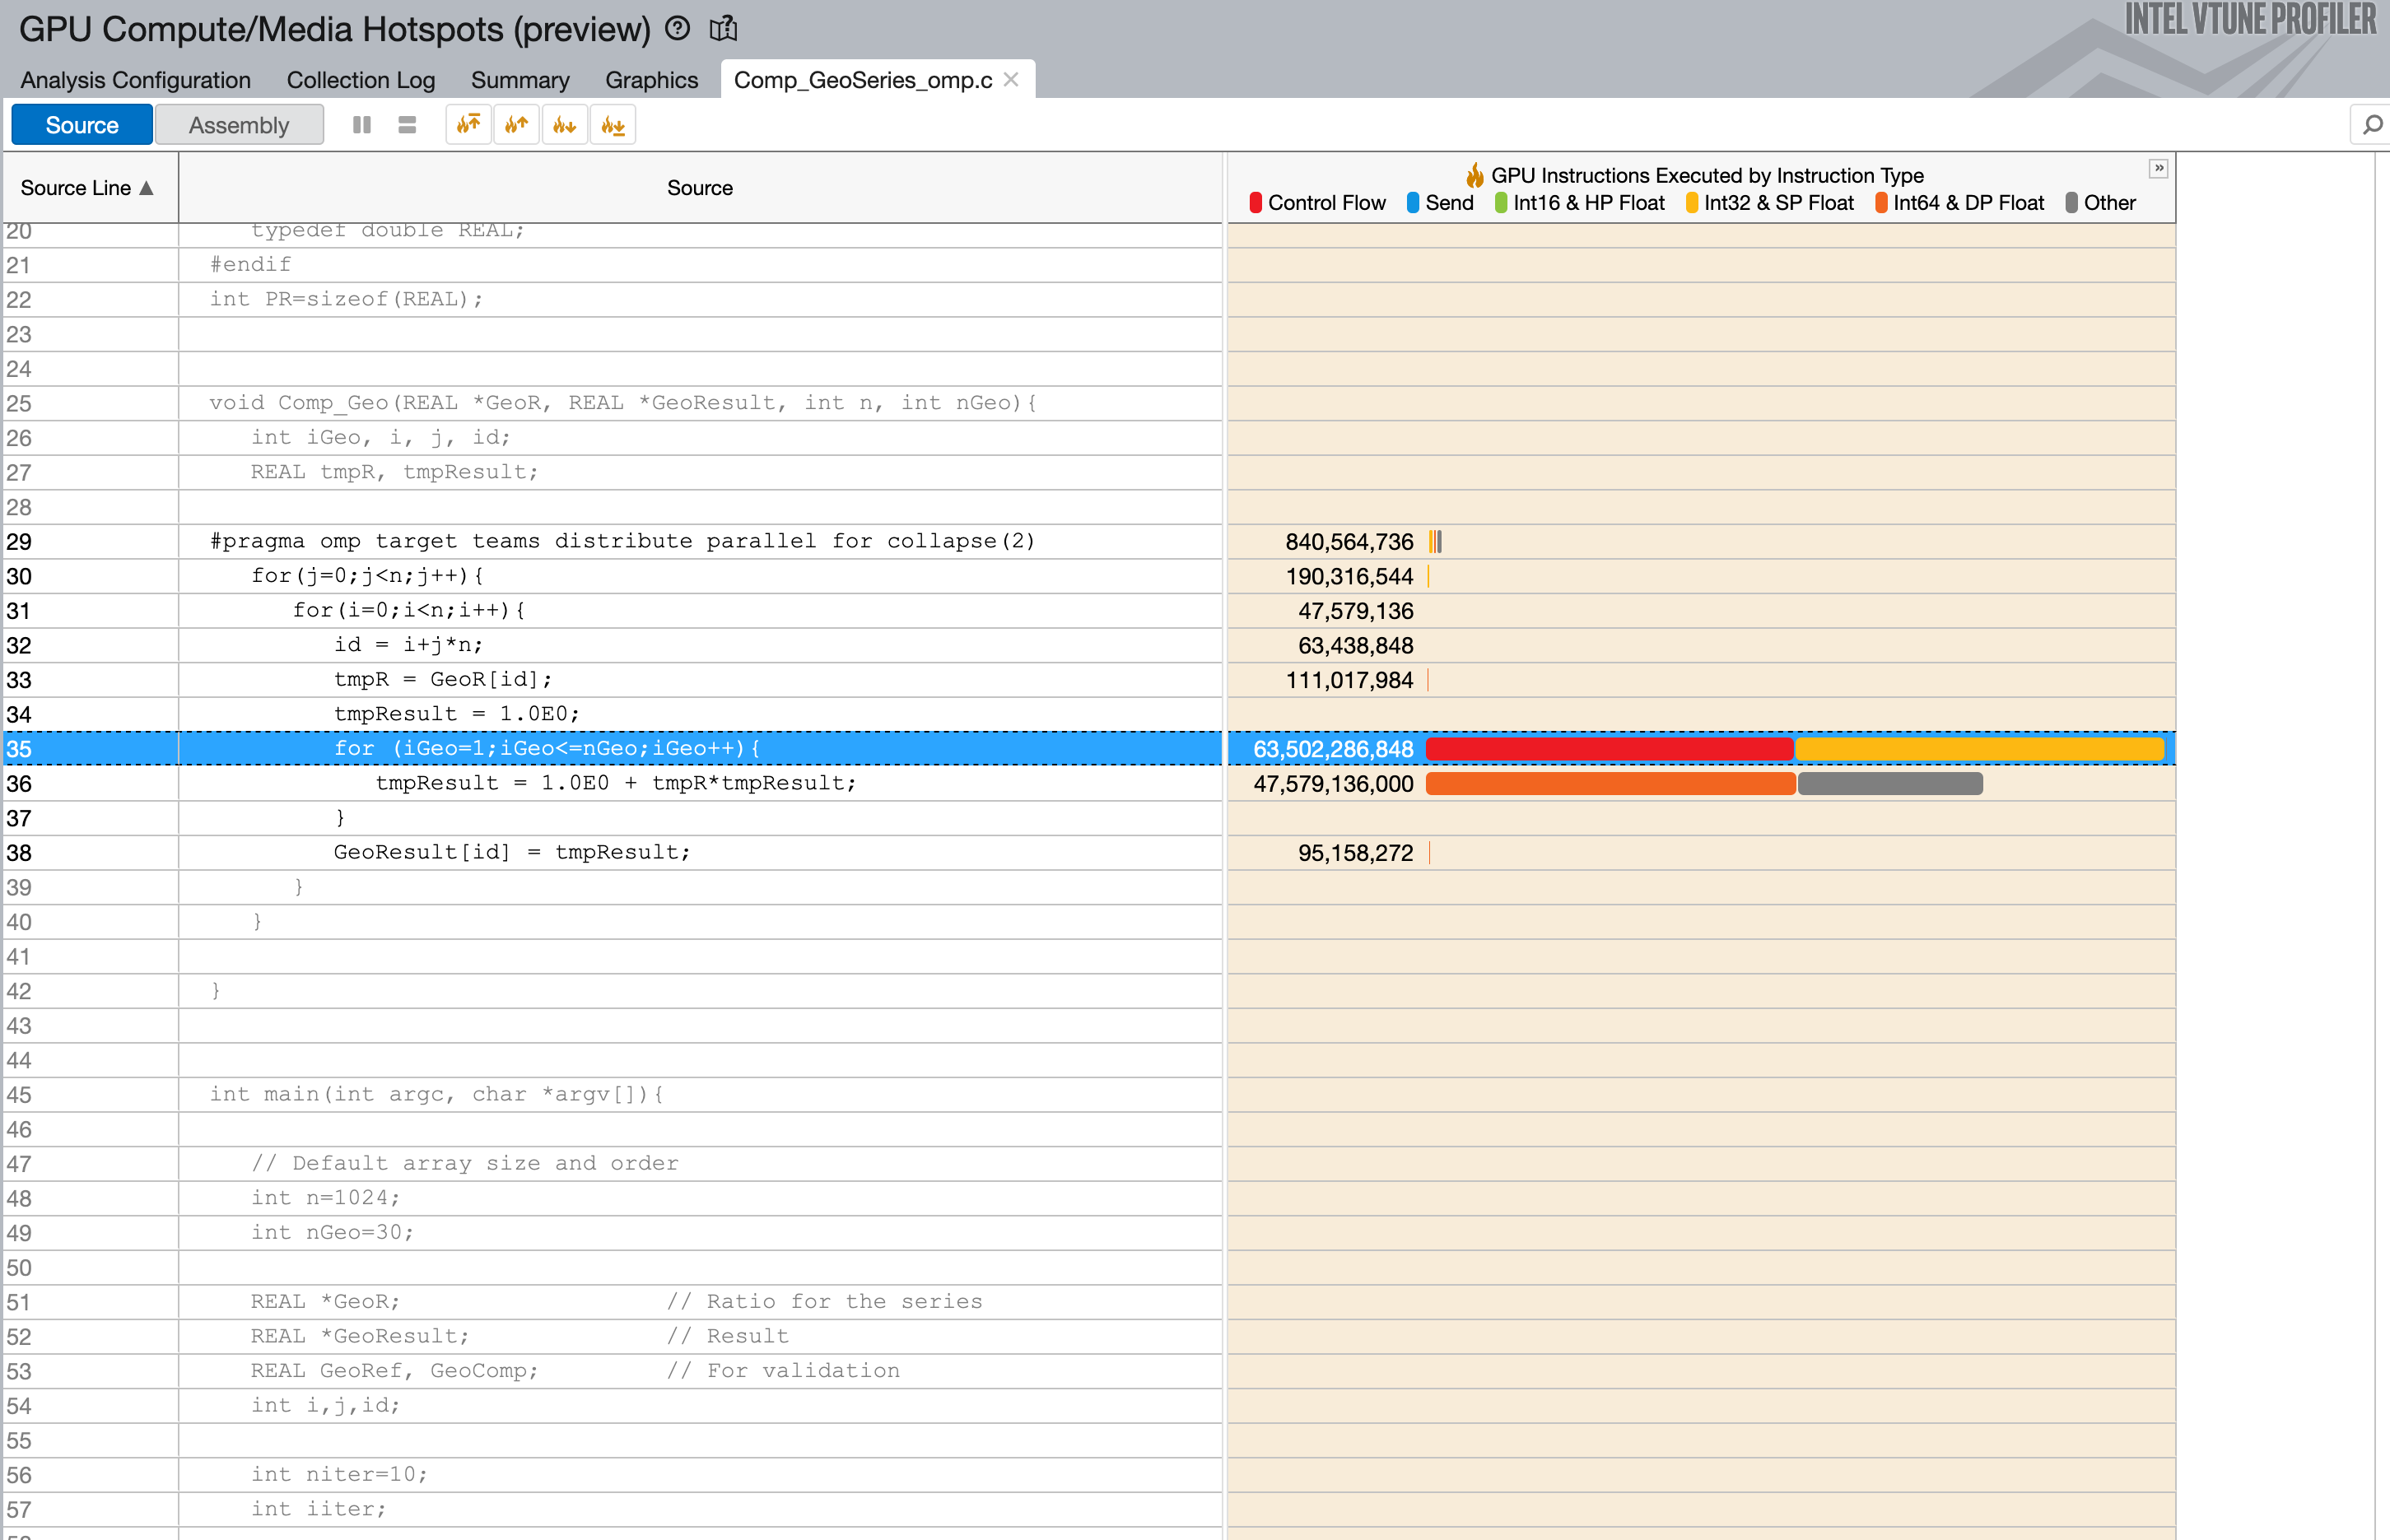

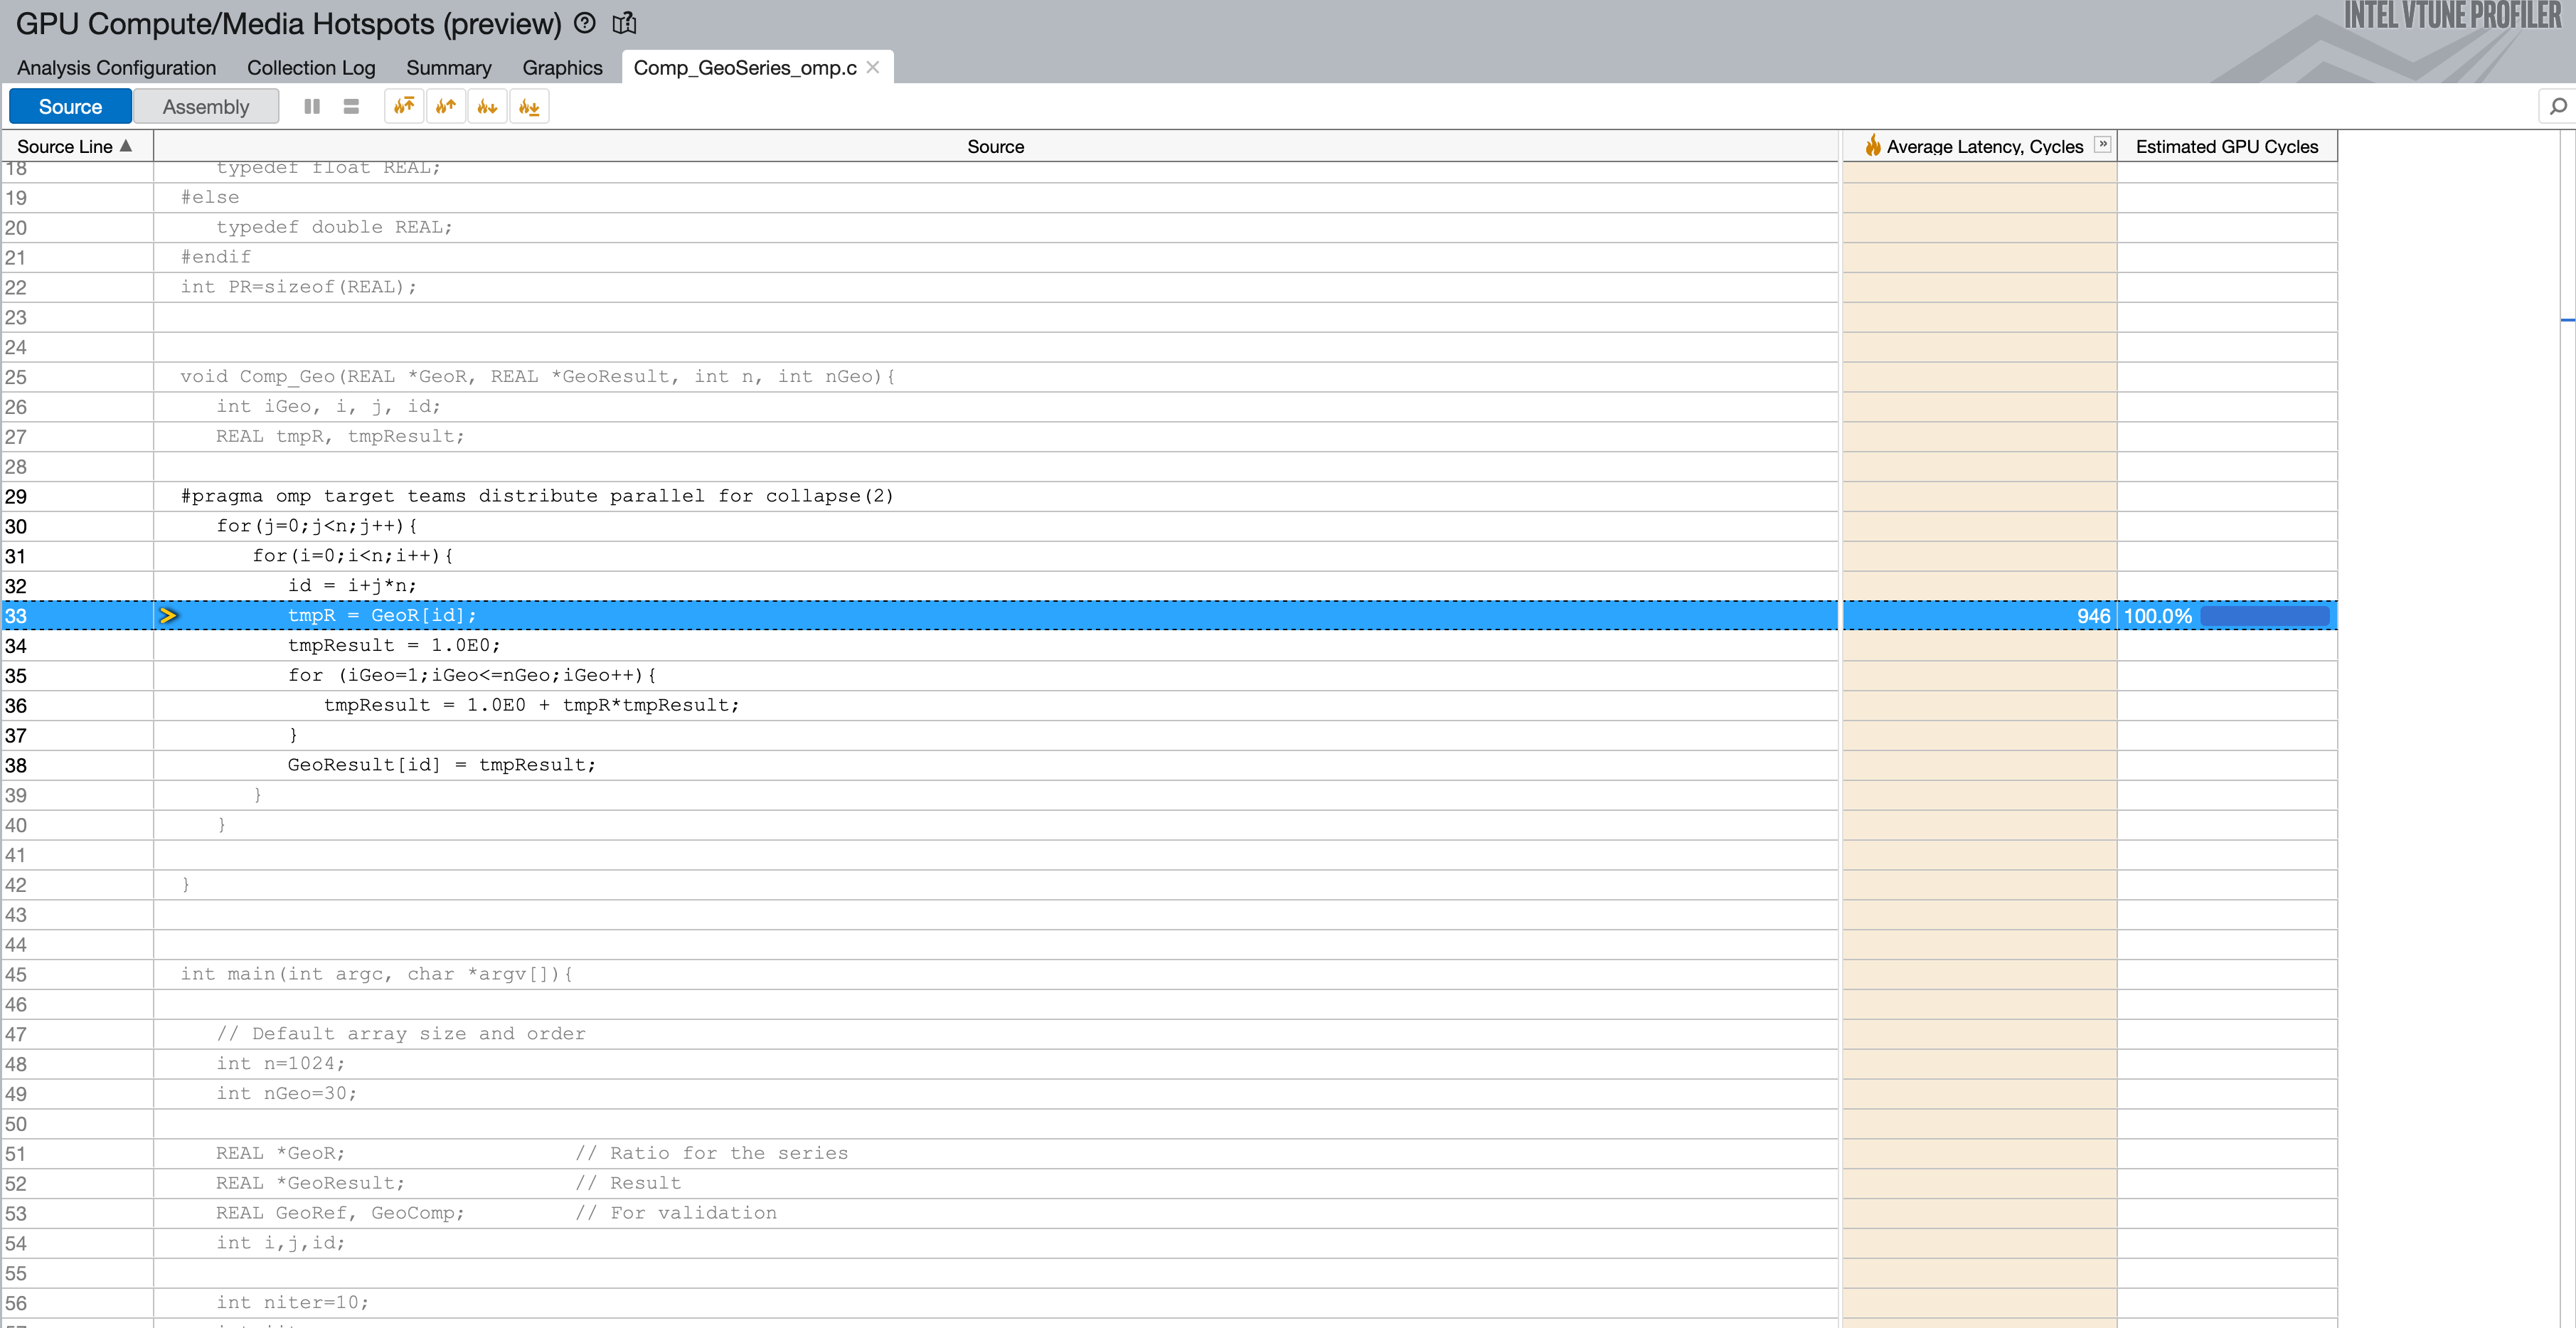
VTune source analysis
$ mpiexec -n 12 gpu_tile_compact.sh vtune -collect gpu-hotspots -knob profiling-mode=source-analysis -r VTune_source ./Comp_GeoSeries_omp_mpicxx_DP 2048 1000
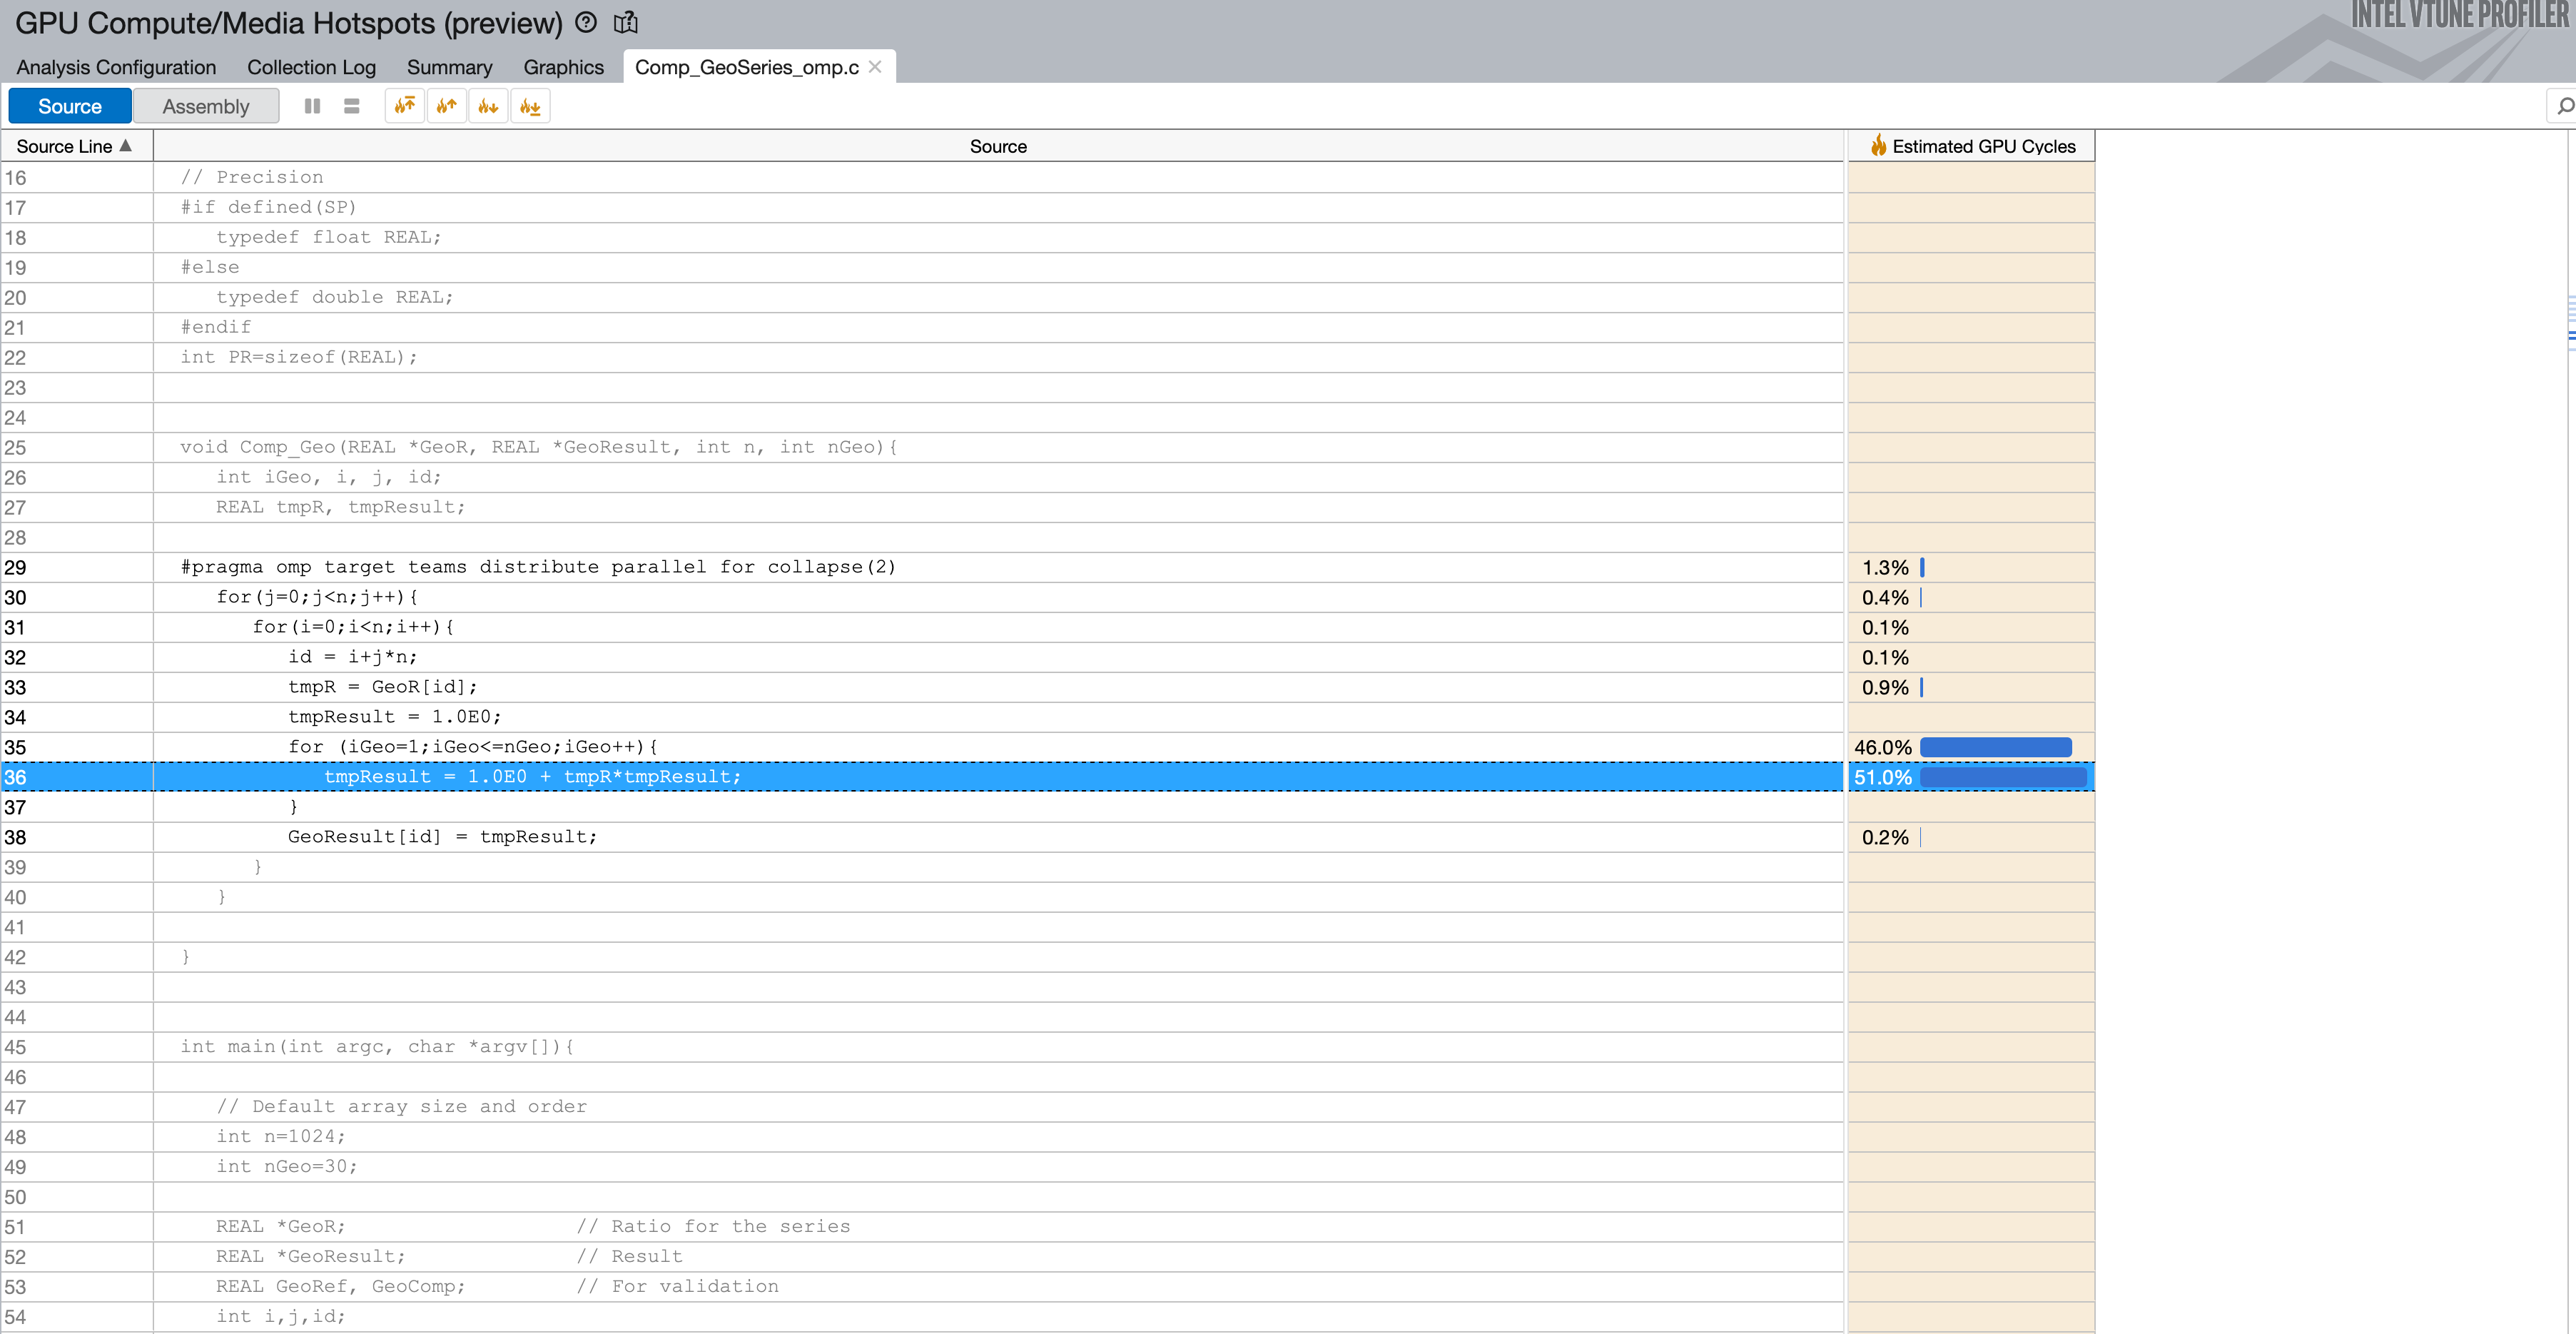
VTune memory latency analysis
$ mpiexec -n 12 gpu_tile_compact.sh vtune -collect gpu-hotspots -knob profiling-mode=source-analysis -knob source-analysis=mem-latency -r VTune_mem-latency ./Comp_GeoSeries_omp_mpicxx_DP 2048 1000
